Open Access
Fig. A.1
Download original image
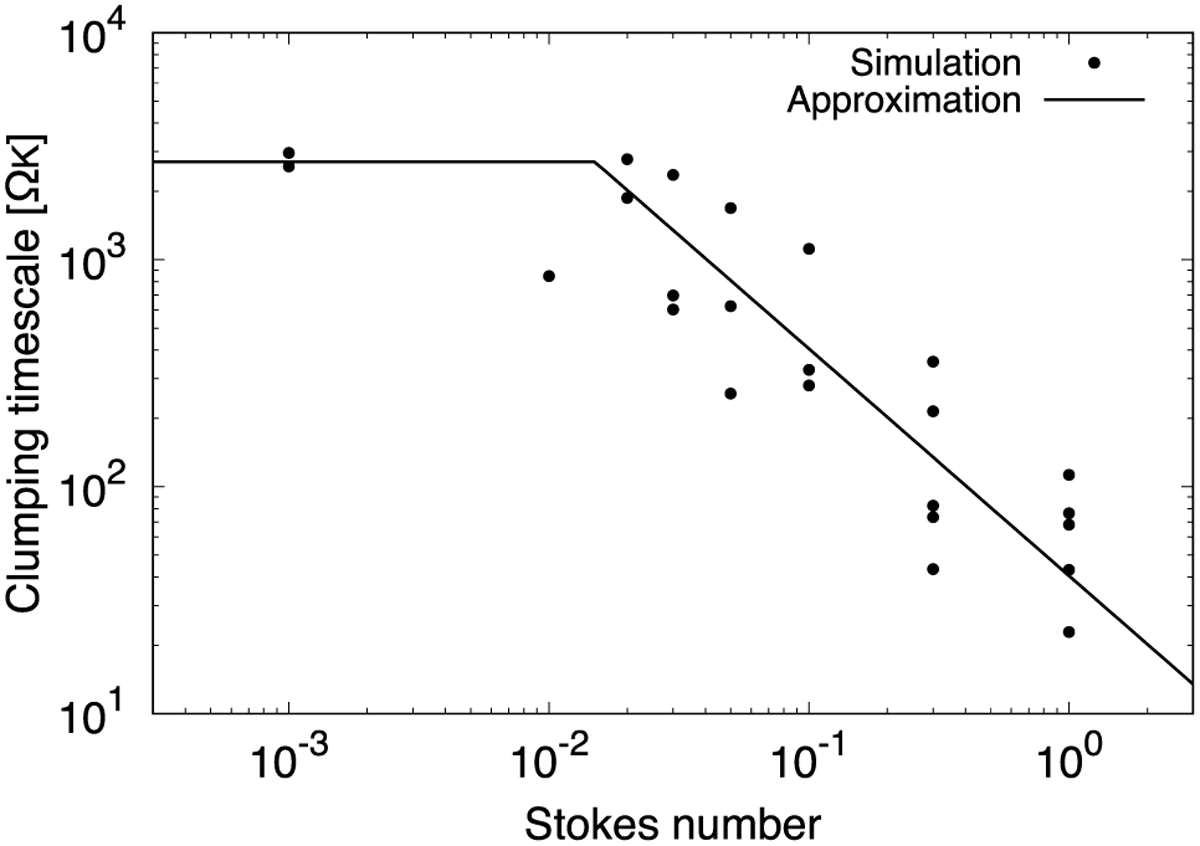
Clumping timescale of dust with various values of Stokes number. The circles represent the simulation results of Li & Youdin (2021; τs in Table 1 and tpre–cl in Table 2 of the paper). The solid curve represents our approximation of the results (Eq. (3.3)).
Current usage metrics show cumulative count of Article Views (full-text article views including HTML views, PDF and ePub downloads, according to the available data) and Abstracts Views on Vision4Press platform.
Data correspond to usage on the plateform after 2015. The current usage metrics is available 48-96 hours after online publication and is updated daily on week days.
Initial download of the metrics may take a while.