Fig. 15
Download original image
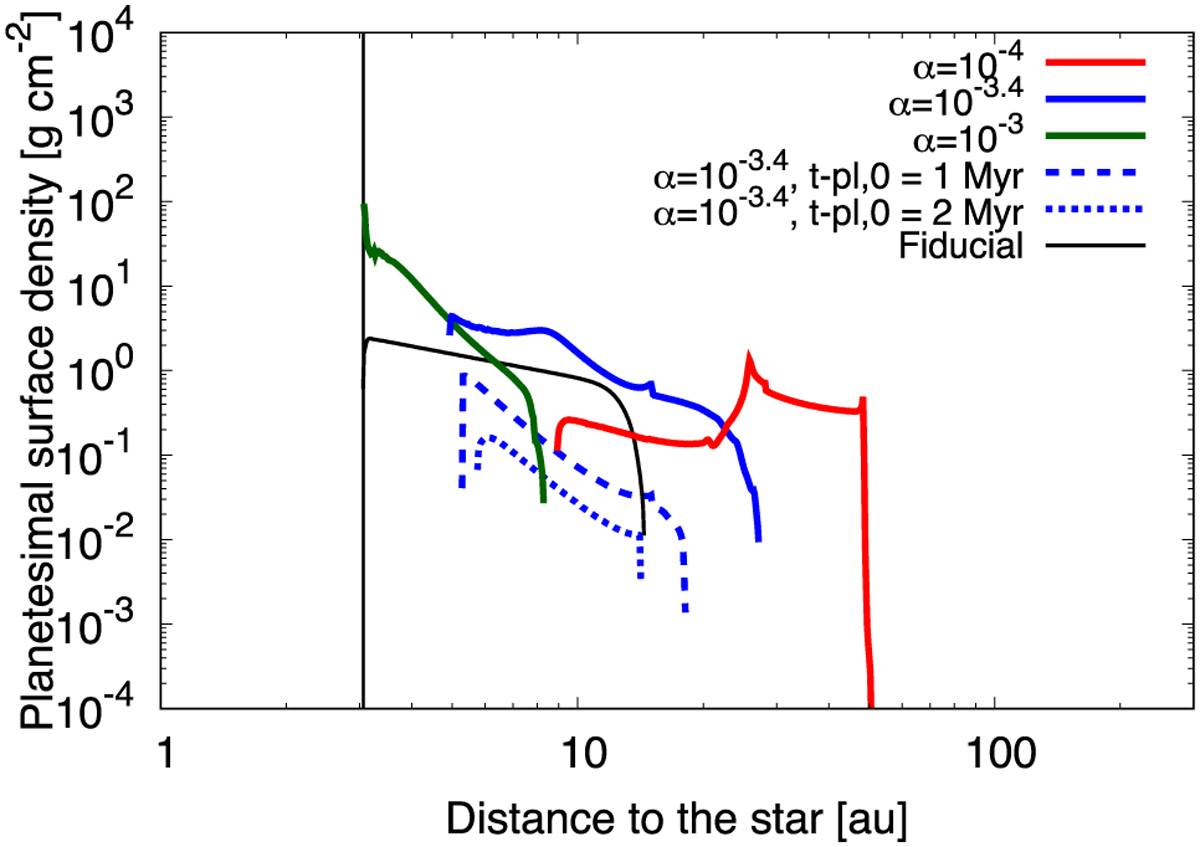
Final profiles of the total planetesimal surface density considering the evolution of the gas disc, the growth of the embedded planet by gas accretion, and Type II migration of the planet. The red, blue, and green solid blue curves represent the profiles with α = 10−4, 10−3.4, and 10−3, respectively. The solid, dashed, and dotted curves are the cases where the planet is put at tpl,0 = 0 Myr, 1 Myr, and 2 Myr, respectively, with α = 10−3.4. The black curve is the case without the additional effects when α = 10−3.4 (the same as the Fiducilal case in the left panel of Fig. 13).
Current usage metrics show cumulative count of Article Views (full-text article views including HTML views, PDF and ePub downloads, according to the available data) and Abstracts Views on Vision4Press platform.
Data correspond to usage on the plateform after 2015. The current usage metrics is available 48-96 hours after online publication and is updated daily on week days.
Initial download of the metrics may take a while.