Fig. 14
Download original image
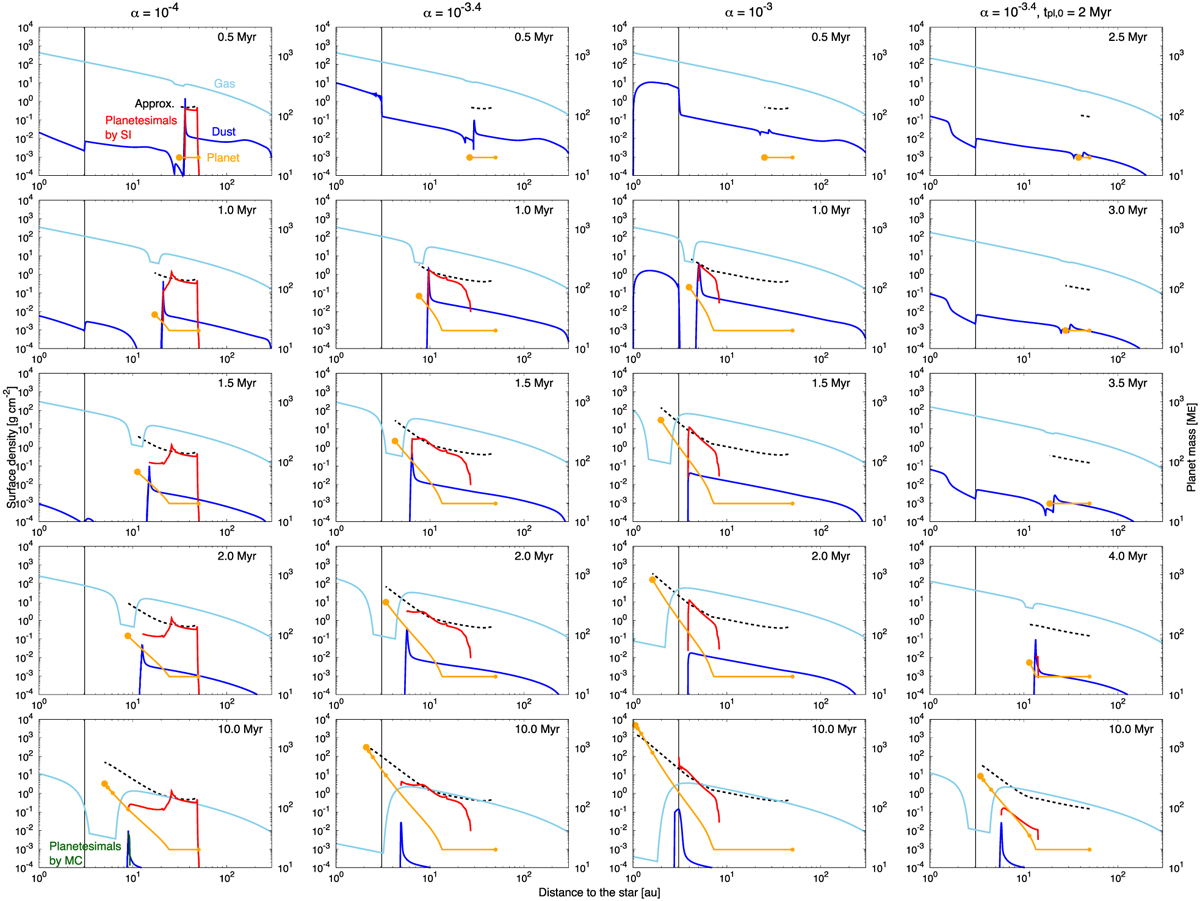
Same as Fig. 1 but considering the evolution of the gas disc, the growth of the embedded planet by gas accretion, and Type II migration of the planet. The red and green curves represent the surface density of the planetesimals formed by streaming instability and mutual collision, respectively. The mass and orbital position of the planet are also plotted (orange), where the large and small circles represent the mass at that time and the mass at every 2 Myr after t = tpl,0, respectively. The black dashed curves are the approximations of the planetesimal surface densities expressed by Eq. (37). The first to third columns from the left represent the evolution with α = 10−4, 10−3.4, and 10−3, respectively. The fourth column is the case with α = 10−3.4, and the planet is put at tpl,0 = 2 Myr.
Current usage metrics show cumulative count of Article Views (full-text article views including HTML views, PDF and ePub downloads, according to the available data) and Abstracts Views on Vision4Press platform.
Data correspond to usage on the plateform after 2015. The current usage metrics is available 48-96 hours after online publication and is updated daily on week days.
Initial download of the metrics may take a while.