Fig. 13
Download original image
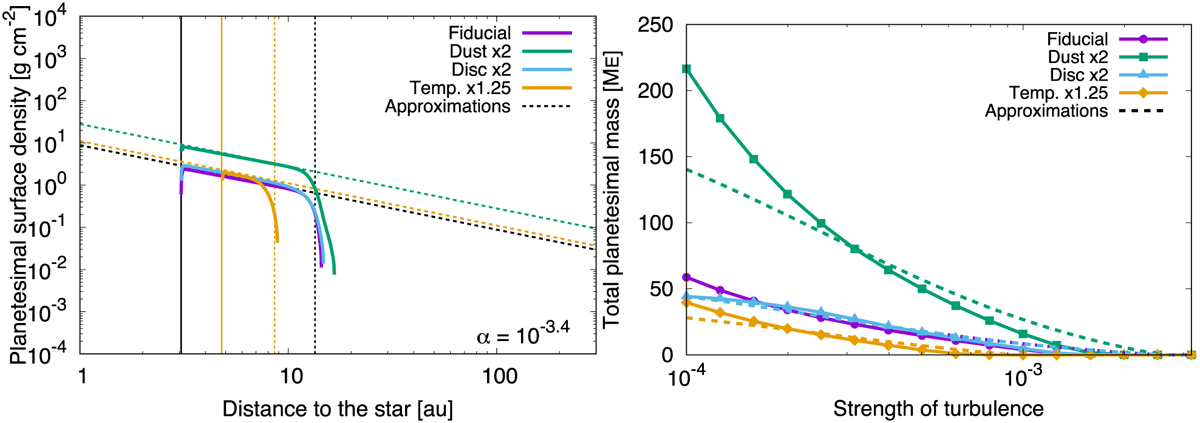
Surface density and total mass of planetesimals with various disc properties. The left panel shows the surface density of the planetesimals (solid lines) and the corresponding approximations by Eq. (30) (dotted lines). The vertical solid and dotted lines represent rSL and rPIM, respectively. The vertical lines with different Zς,0 and Σg,1au overlap with those of the fiducial case. The right panel shows the total planetesimal mass (solid curves) and the corresponding approximations by Eqs. (25) and (30) (dashed curves).
Current usage metrics show cumulative count of Article Views (full-text article views including HTML views, PDF and ePub downloads, according to the available data) and Abstracts Views on Vision4Press platform.
Data correspond to usage on the plateform after 2015. The current usage metrics is available 48-96 hours after online publication and is updated daily on week days.
Initial download of the metrics may take a while.