Open Access
Fig. A.2
Download original image
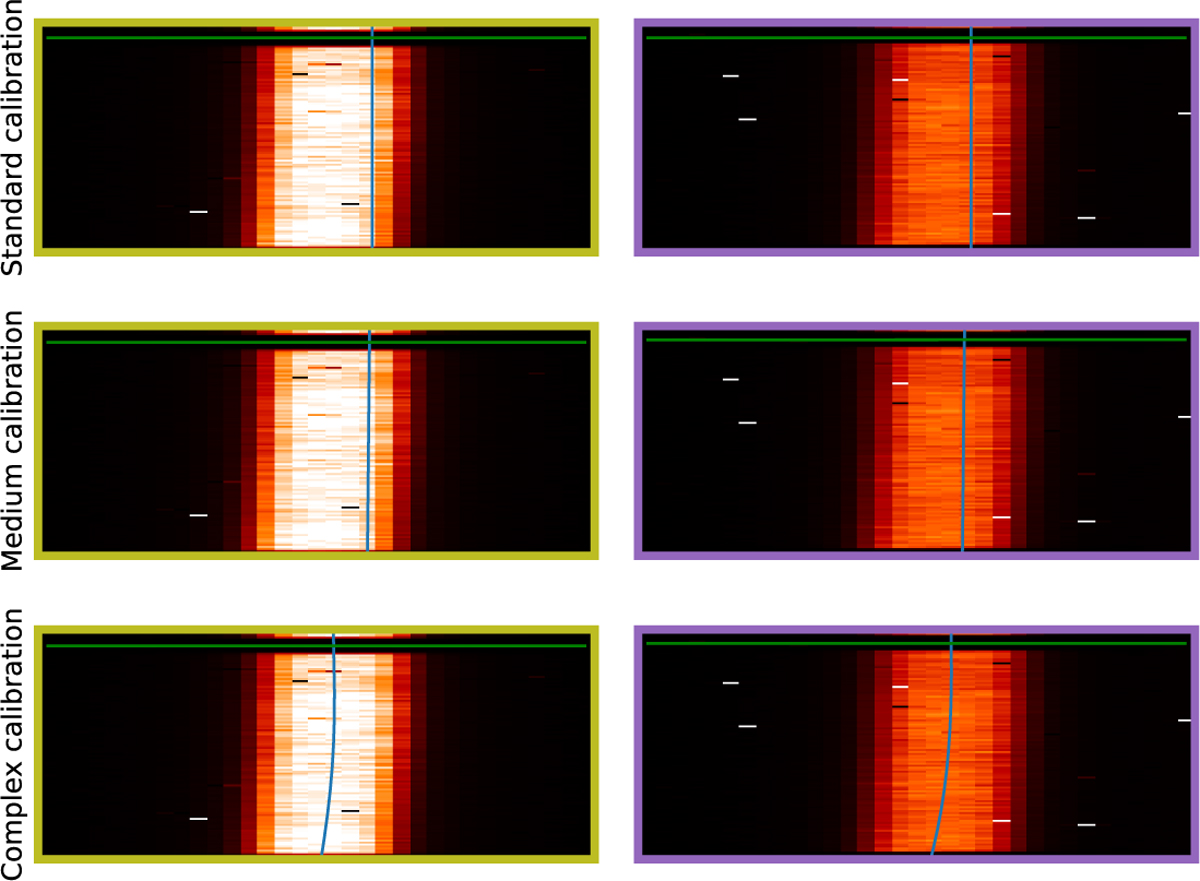
Magnified images of the two regions outlined by the yellow and purple rectangles for the three models described in Sect. 4.2. To best see the differences between models, the magnifications are different in the two dimensions.
Current usage metrics show cumulative count of Article Views (full-text article views including HTML views, PDF and ePub downloads, according to the available data) and Abstracts Views on Vision4Press platform.
Data correspond to usage on the plateform after 2015. The current usage metrics is available 48-96 hours after online publication and is updated daily on week days.
Initial download of the metrics may take a while.