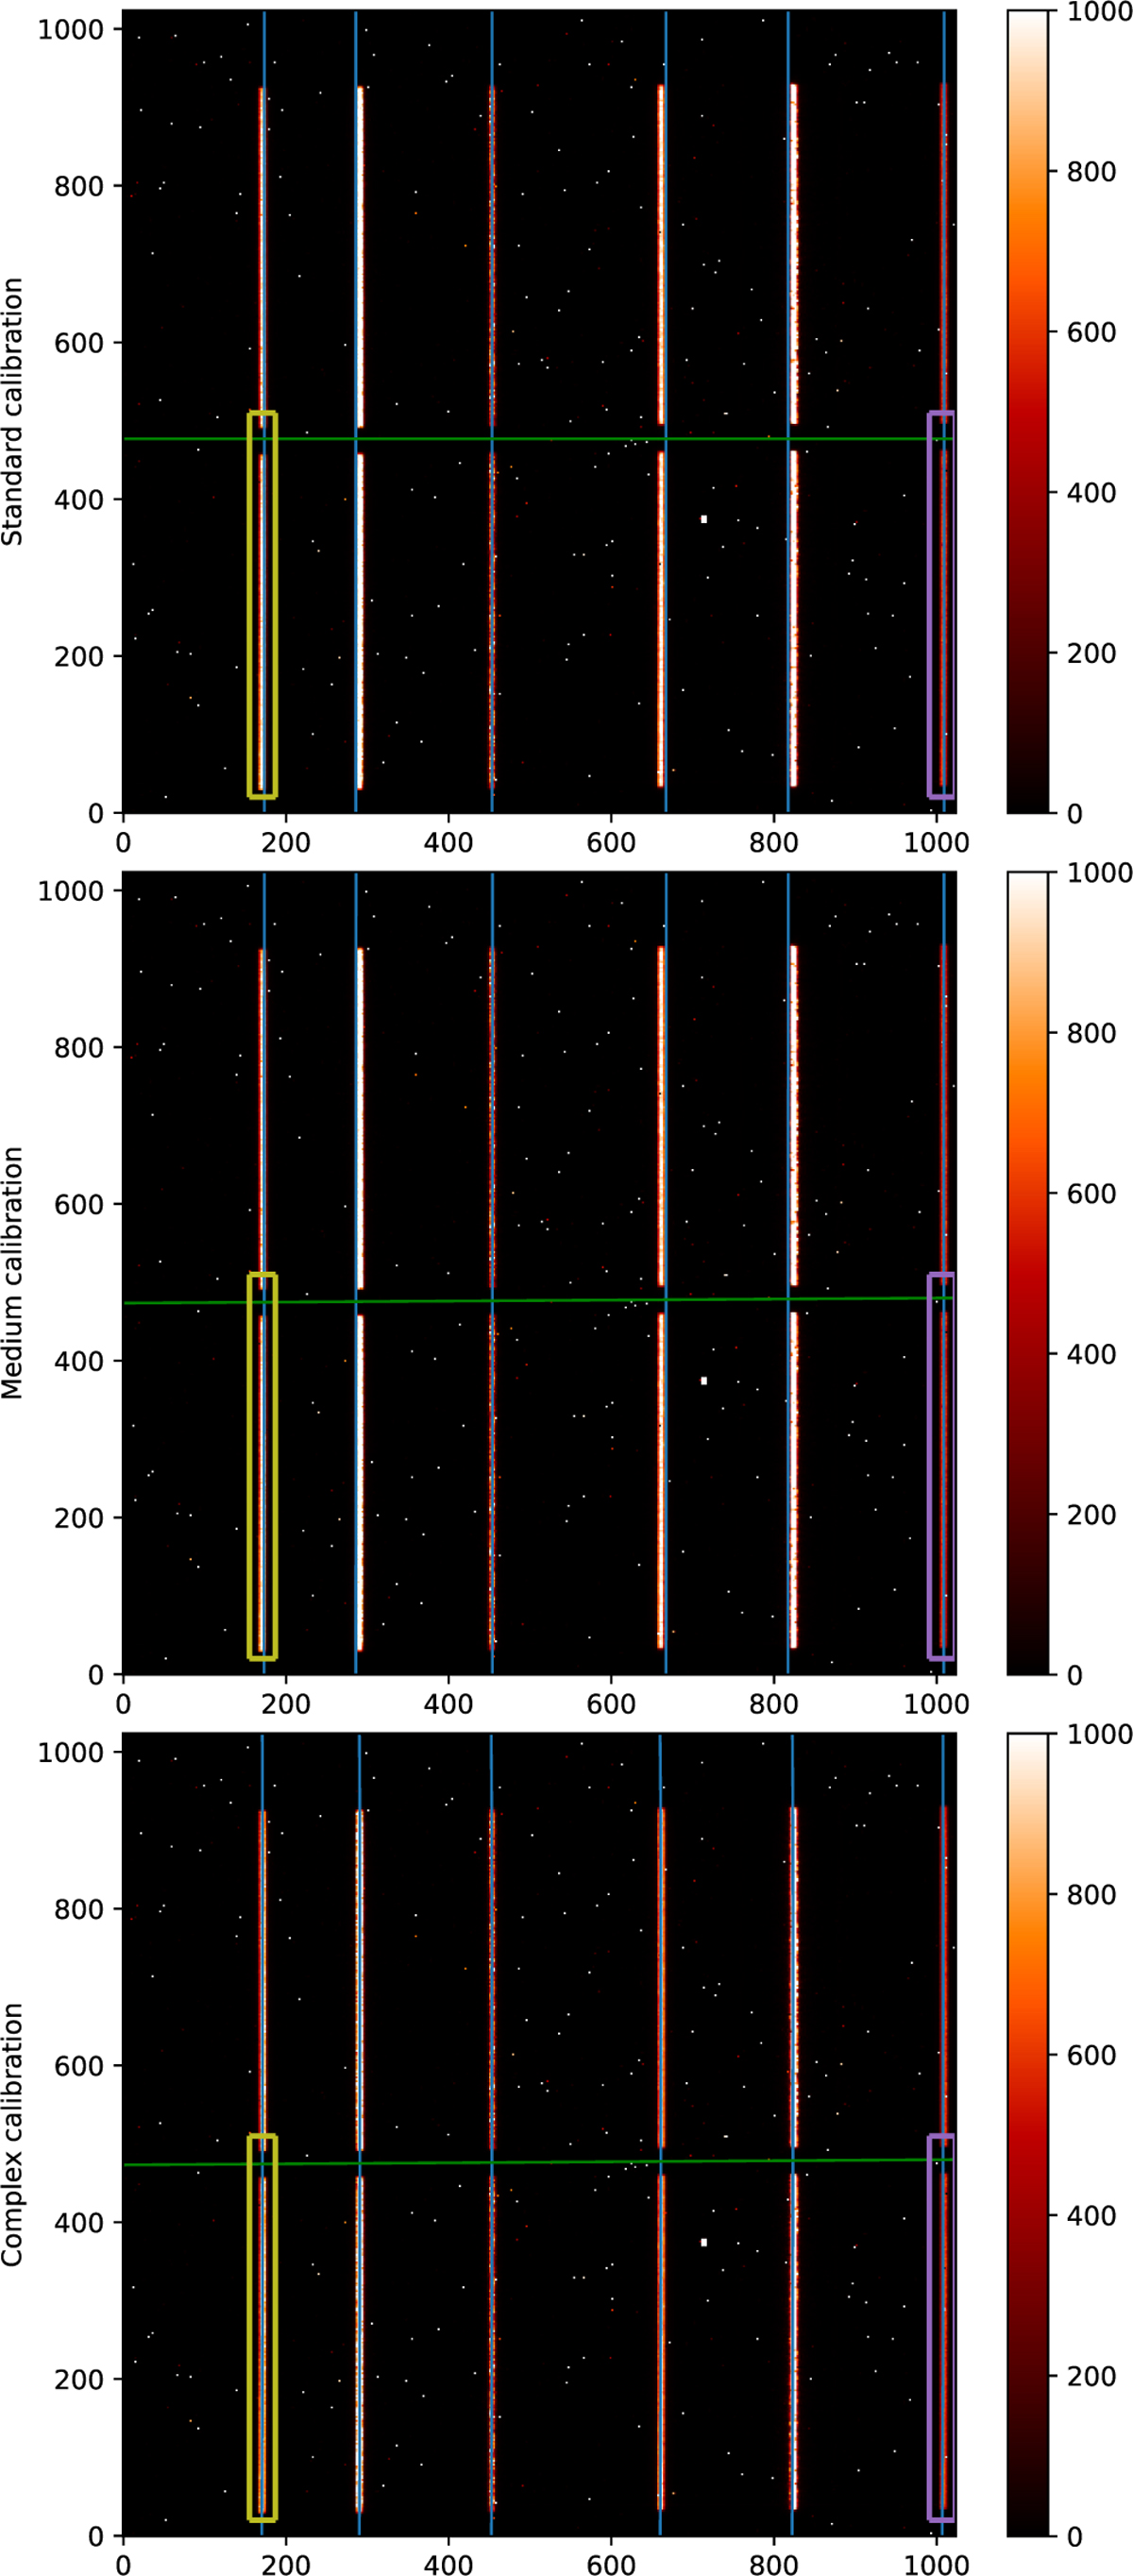
Fig. A.1
Download original image
Iso-wavelength curves at the wavelengths of the calibration sources (blue lines) and iso-angular distance of the center of the coron-agraphic mask of (green lines) presented on top of the calibration data, dcal. The upper panel presents the results for the simple model, the central panel shows the results for the medium model, while the bottom panel shows the results of using the complex model.
Current usage metrics show cumulative count of Article Views (full-text article views including HTML views, PDF and ePub downloads, according to the available data) and Abstracts Views on Vision4Press platform.
Data correspond to usage on the plateform after 2015. The current usage metrics is available 48-96 hours after online publication and is updated daily on week days.
Initial download of the metrics may take a while.