Fig. 12
Download original image
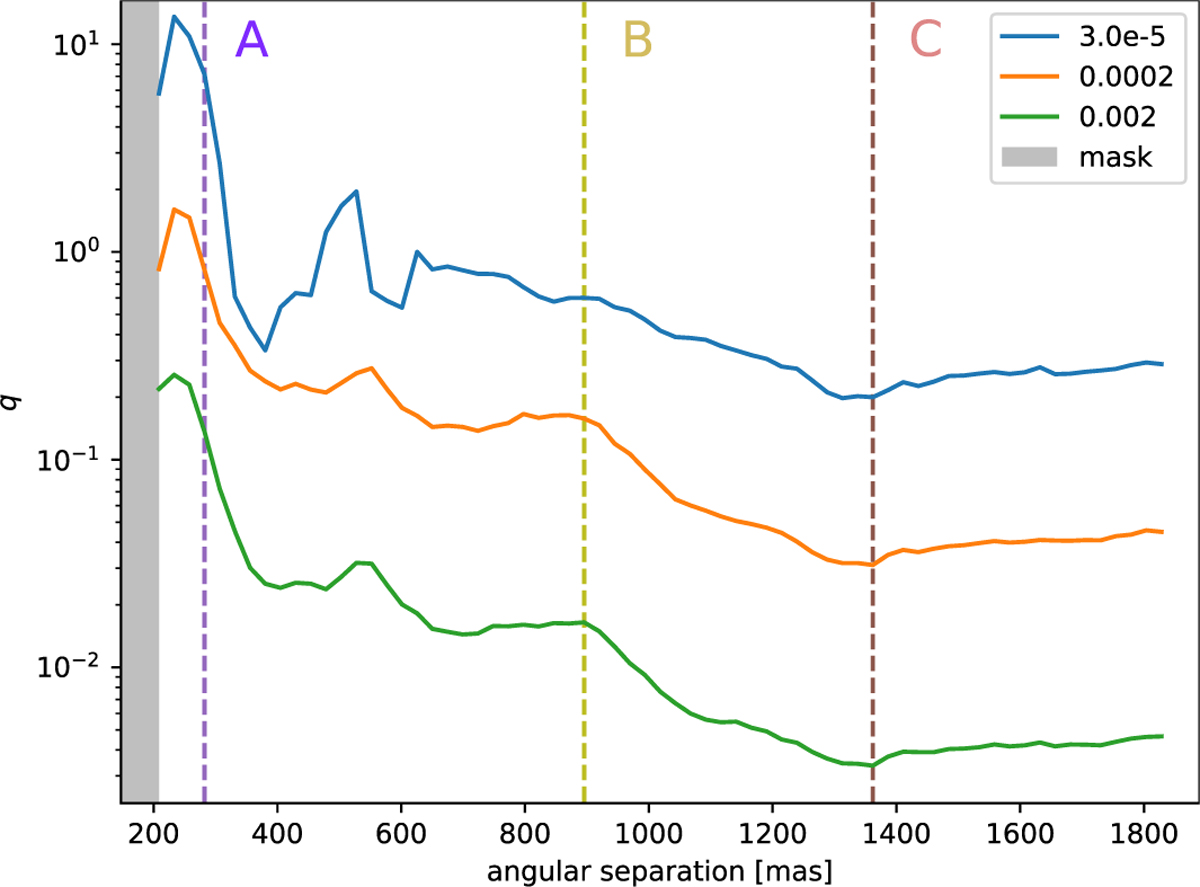
Relative error q defined in Eq. (36) for synthetic companions injected in the scientific data of HIP 65426 (with the same spectra as the host star) as a function of the angular separation, ρ⊕ − ρ★, and for contrasts of χ = 3 × 10⁻⁵ (blue), 2 × 10⁻⁴ (orange), and 2 × 10⁻² (green). The grayed area represents the region invalidated by the coronagraphic mask. The angular separations of the three cases presented in Fig. 11 are highlighted by the dashed lines labeled A, B, and C.
Current usage metrics show cumulative count of Article Views (full-text article views including HTML views, PDF and ePub downloads, according to the available data) and Abstracts Views on Vision4Press platform.
Data correspond to usage on the plateform after 2015. The current usage metrics is available 48-96 hours after online publication and is updated daily on week days.
Initial download of the metrics may take a while.