Fig. 2.
Download original image
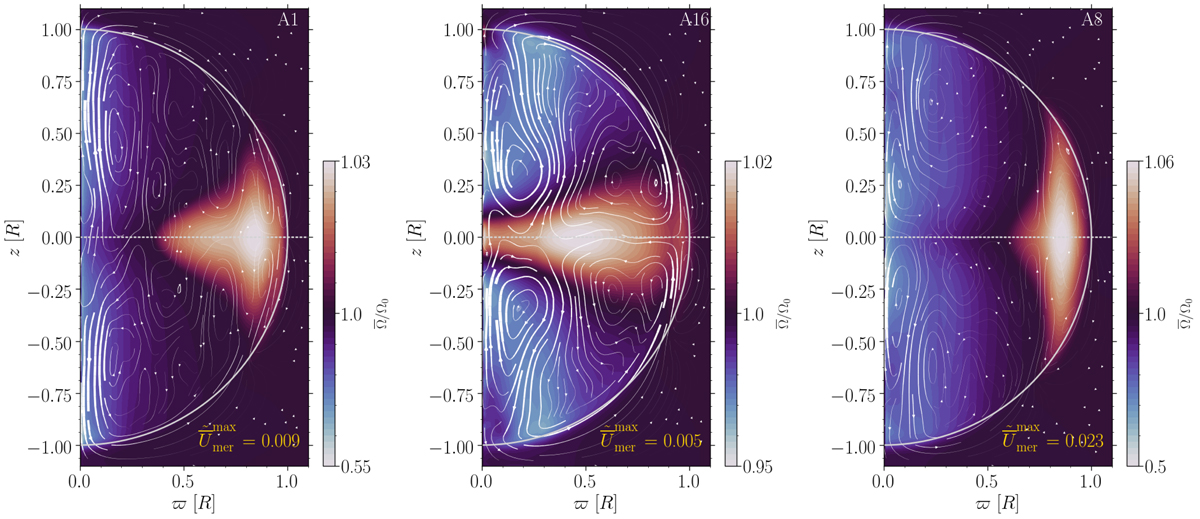
Normalised time-averaged mean angular velocity ![]() for simulations A1 (left), A16 (middle), and A8 (right). The coloured contours indicate
for simulations A1 (left), A16 (middle), and A8 (right). The coloured contours indicate ![]() . The streamlines indicate the mass flux due to meridional circulation. The amplitude of the meridional flow speed (
. The streamlines indicate the mass flux due to meridional circulation. The amplitude of the meridional flow speed (![]() ) is indicated in the lower right corner of each panel. The surface is indicated by the grey line, while the equator is indicated by the grey dotted line.
) is indicated in the lower right corner of each panel. The surface is indicated by the grey line, while the equator is indicated by the grey dotted line.
Current usage metrics show cumulative count of Article Views (full-text article views including HTML views, PDF and ePub downloads, according to the available data) and Abstracts Views on Vision4Press platform.
Data correspond to usage on the plateform after 2015. The current usage metrics is available 48-96 hours after online publication and is updated daily on week days.
Initial download of the metrics may take a while.