Open Access
Fig. 6
Download original image
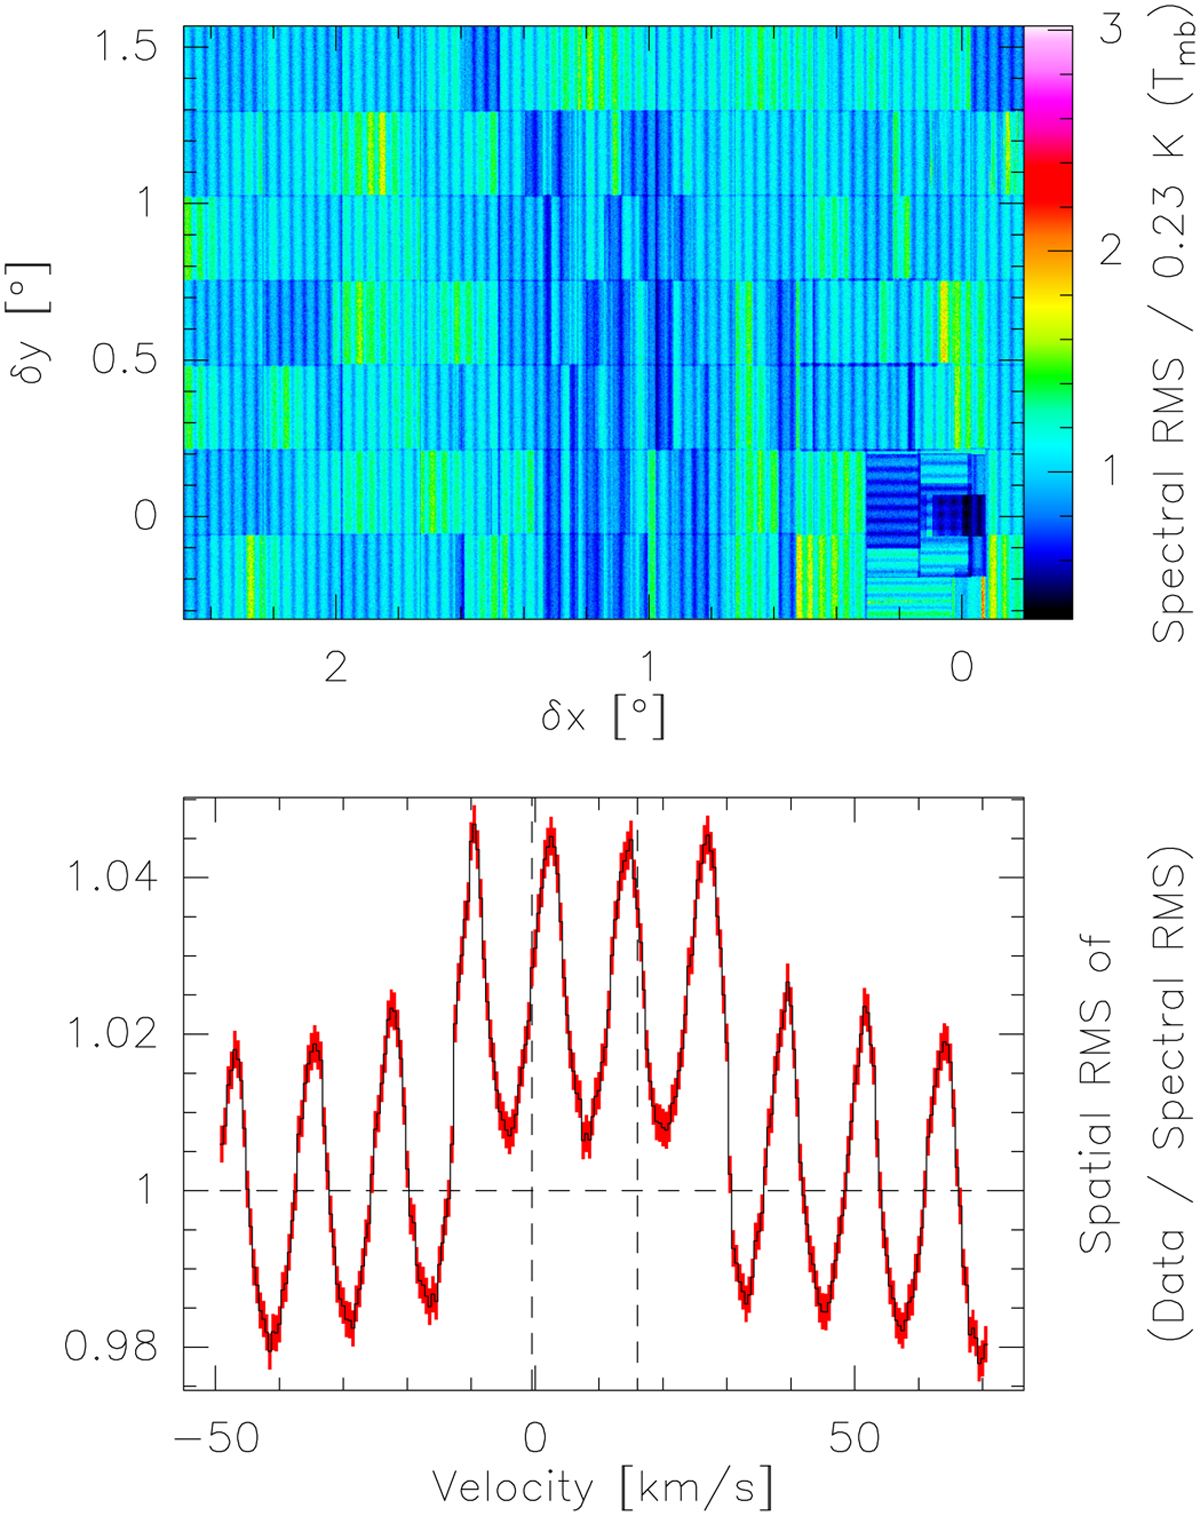
Noise spatial (top) and spectral (bottom) variations for the C17O (1–0) line cube. The spatial maps were normalized by the median noise value. The red region in the bottom panels shows the 3σ uncertainty interval of the computation.
Current usage metrics show cumulative count of Article Views (full-text article views including HTML views, PDF and ePub downloads, according to the available data) and Abstracts Views on Vision4Press platform.
Data correspond to usage on the plateform after 2015. The current usage metrics is available 48-96 hours after online publication and is updated daily on week days.
Initial download of the metrics may take a while.