Fig. 3
Download original image
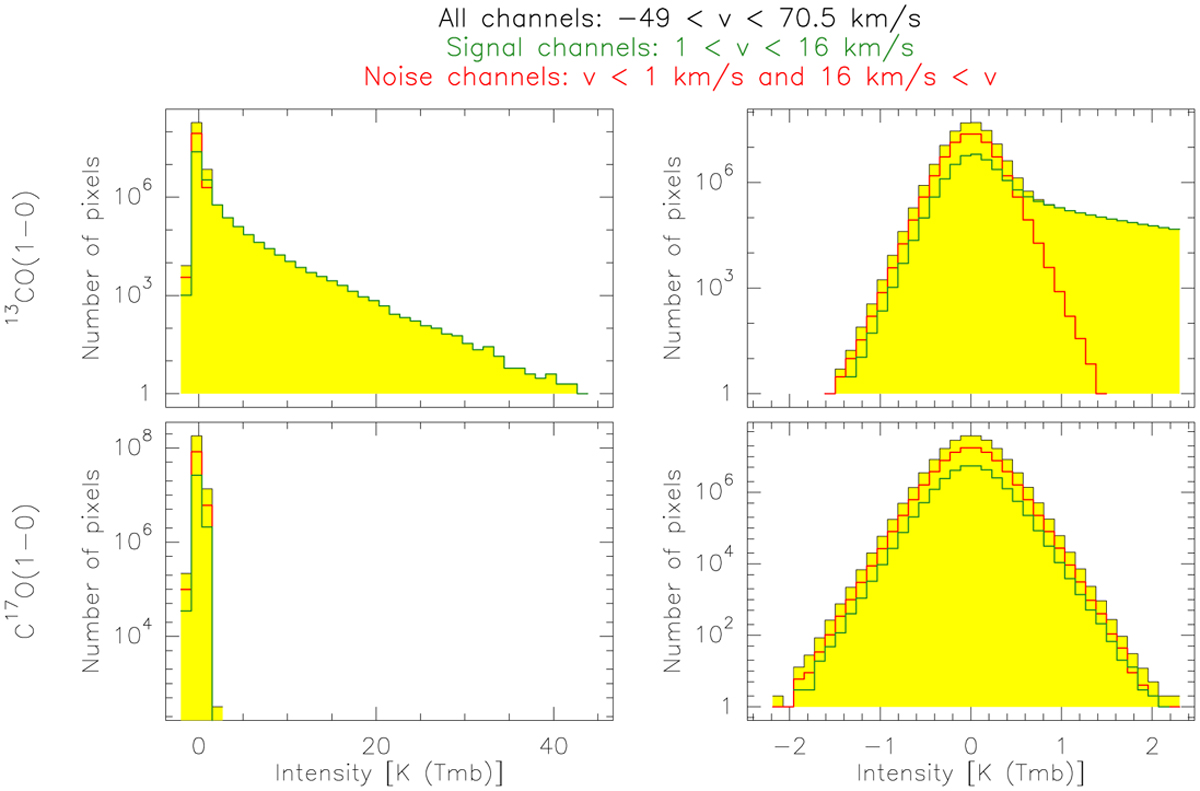
Comparison of the histograms of the intensity of the two radio-astronomy lines. The left column shows the full intensity dynamical range, while the right column zoom on faint intensity. The black histogram is computed over all the data channels. The red and green histograms are computed over the channel ranges that contains either mostly noise or high signal-to-noise ratio intensity, respectively.
Current usage metrics show cumulative count of Article Views (full-text article views including HTML views, PDF and ePub downloads, according to the available data) and Abstracts Views on Vision4Press platform.
Data correspond to usage on the plateform after 2015. The current usage metrics is available 48-96 hours after online publication and is updated daily on week days.
Initial download of the metrics may take a while.