Fig. 21
Download original image
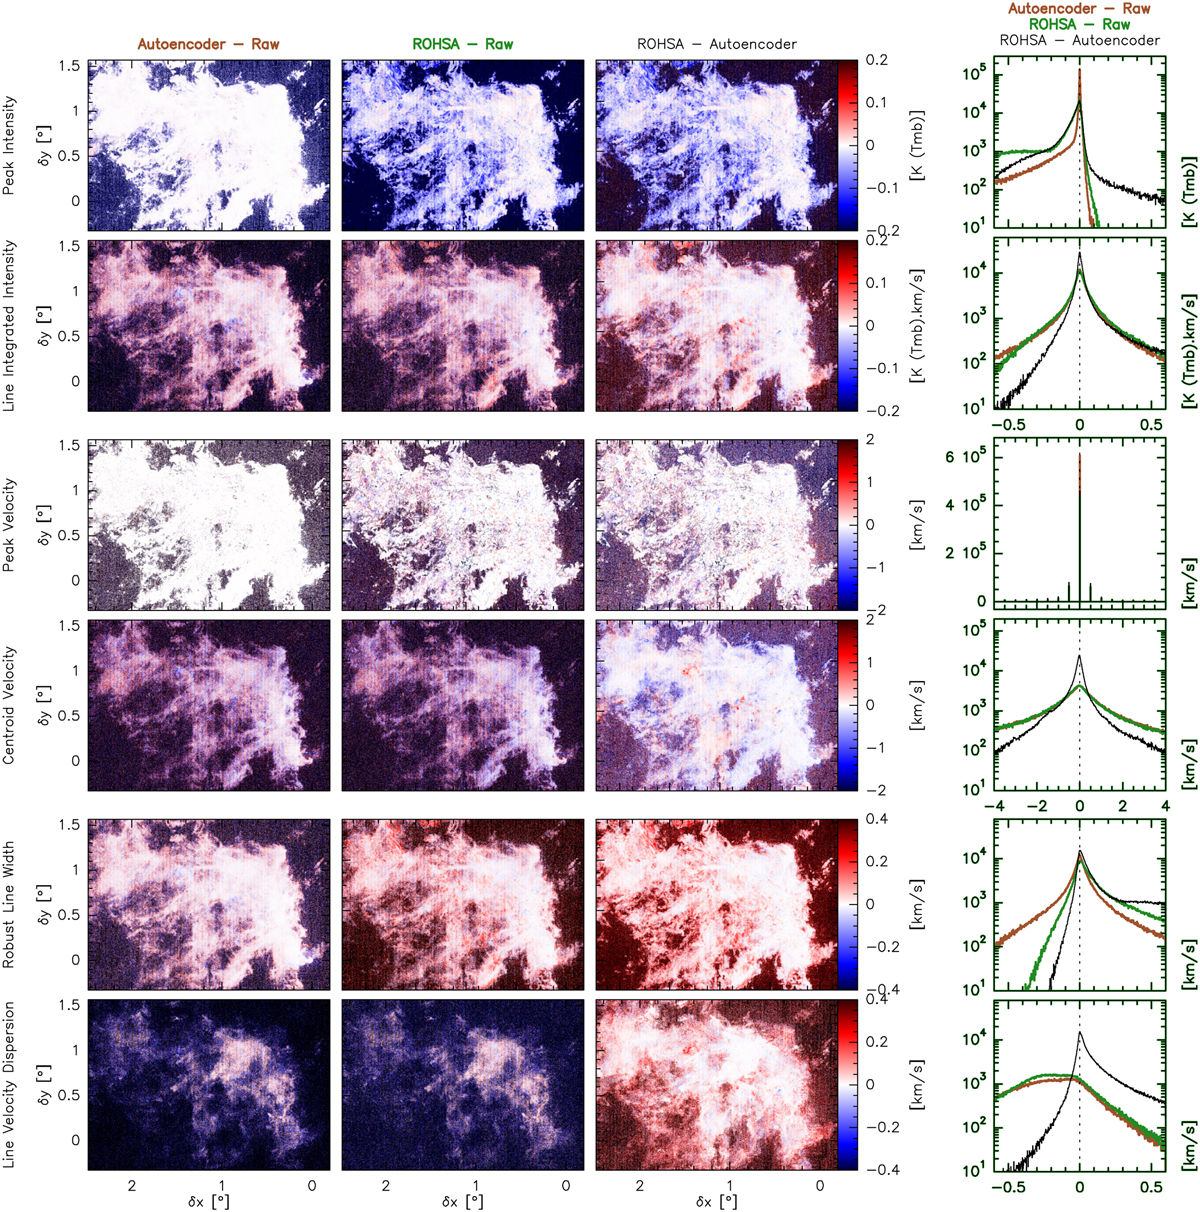
Maps and histograms of the residuals of the properties of the 13CO (1−0) line. The properties are the same as for Fig. 20. The first, second, and third columns show the maps of residuals between the autoencoder denoised and raw data, the ROHSA denoised and raw data, and the ROHSA and autoencoder denoised data, respectively. The color scales are saturated in order to emphasize the differences where some signal is detected. The fourth column shows the associated histograms. The brown and green lines show the residuals from the autoencoder and ROHSA denoising, respectively. The black lines show the difference between the autoencoder and ROHSA results.
Current usage metrics show cumulative count of Article Views (full-text article views including HTML views, PDF and ePub downloads, according to the available data) and Abstracts Views on Vision4Press platform.
Data correspond to usage on the plateform after 2015. The current usage metrics is available 48-96 hours after online publication and is updated daily on week days.
Initial download of the metrics may take a while.