Fig. 20
Download original image
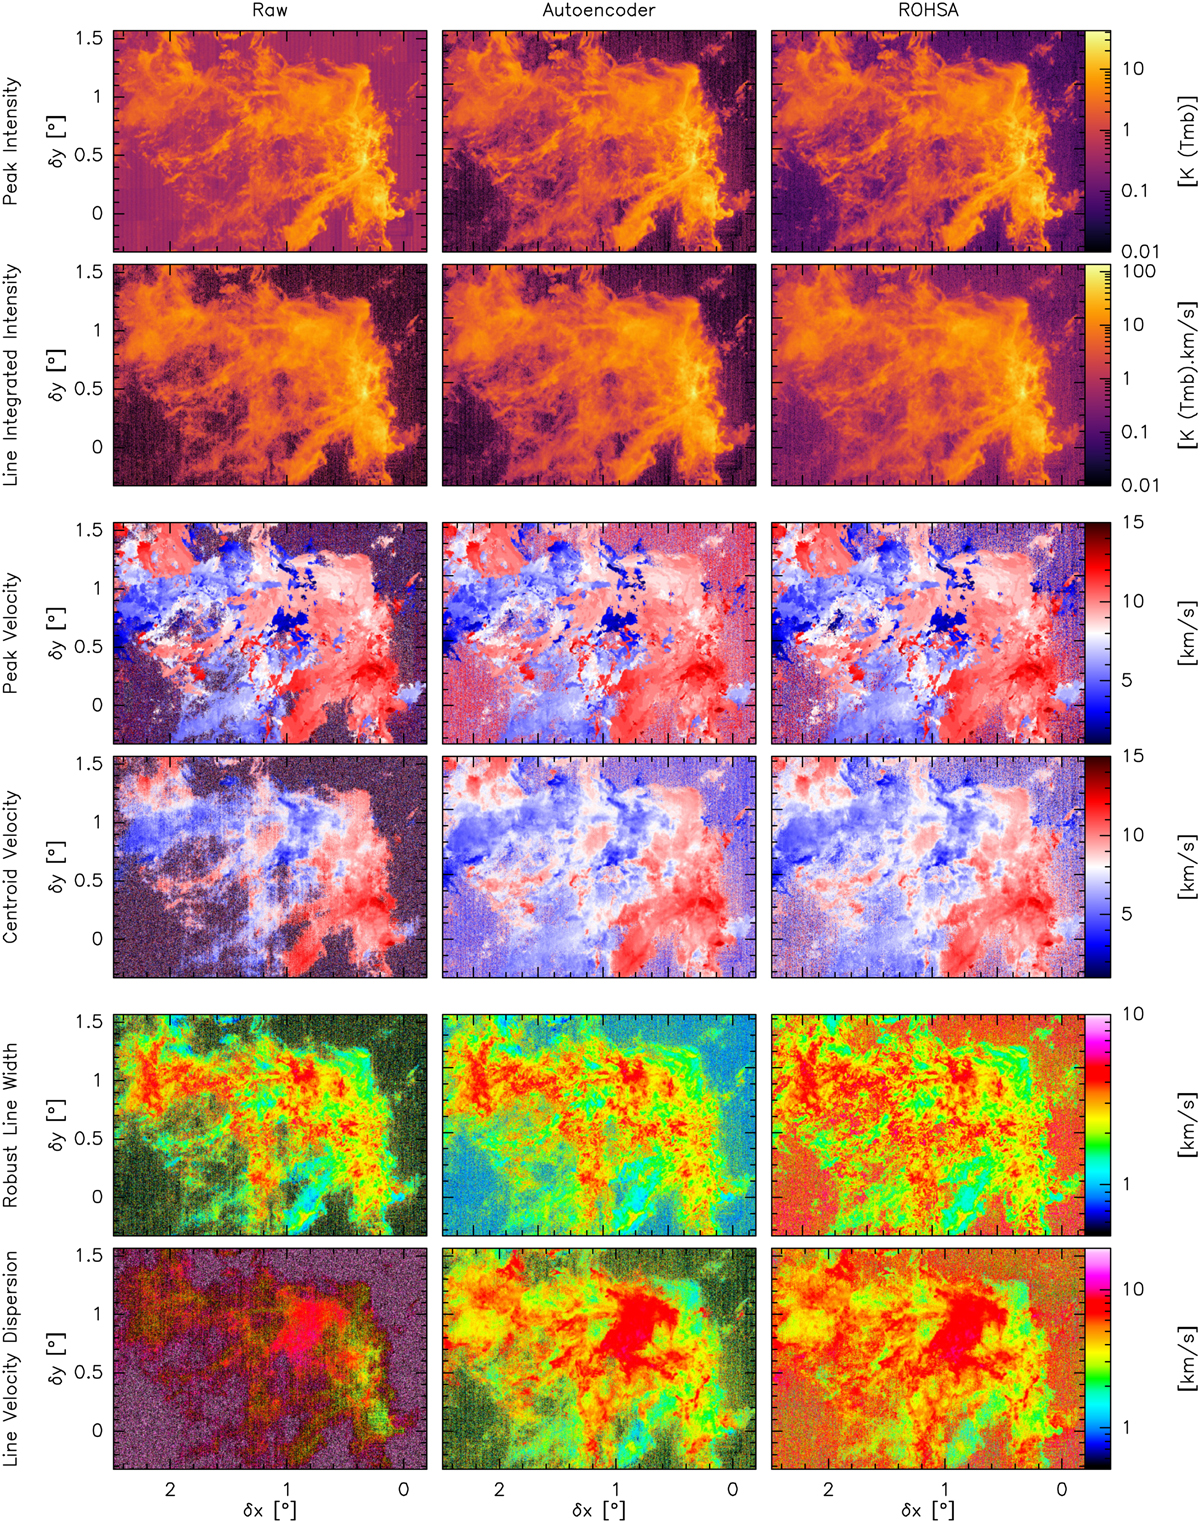
Maps of the properties of the 13CO (1–0) line before (left) and after denoising with the autoencoder (middle) and ROHSA (right). From top to bottom, the properties are the maximum of the line, the line integrated intensity, the velocity of the maximum, the centroid velocity, a robust estimation of the line width, and the velocity dispersion.
Current usage metrics show cumulative count of Article Views (full-text article views including HTML views, PDF and ePub downloads, according to the available data) and Abstracts Views on Vision4Press platform.
Data correspond to usage on the plateform after 2015. The current usage metrics is available 48-96 hours after online publication and is updated daily on week days.
Initial download of the metrics may take a while.