Fig. 2
Download original image
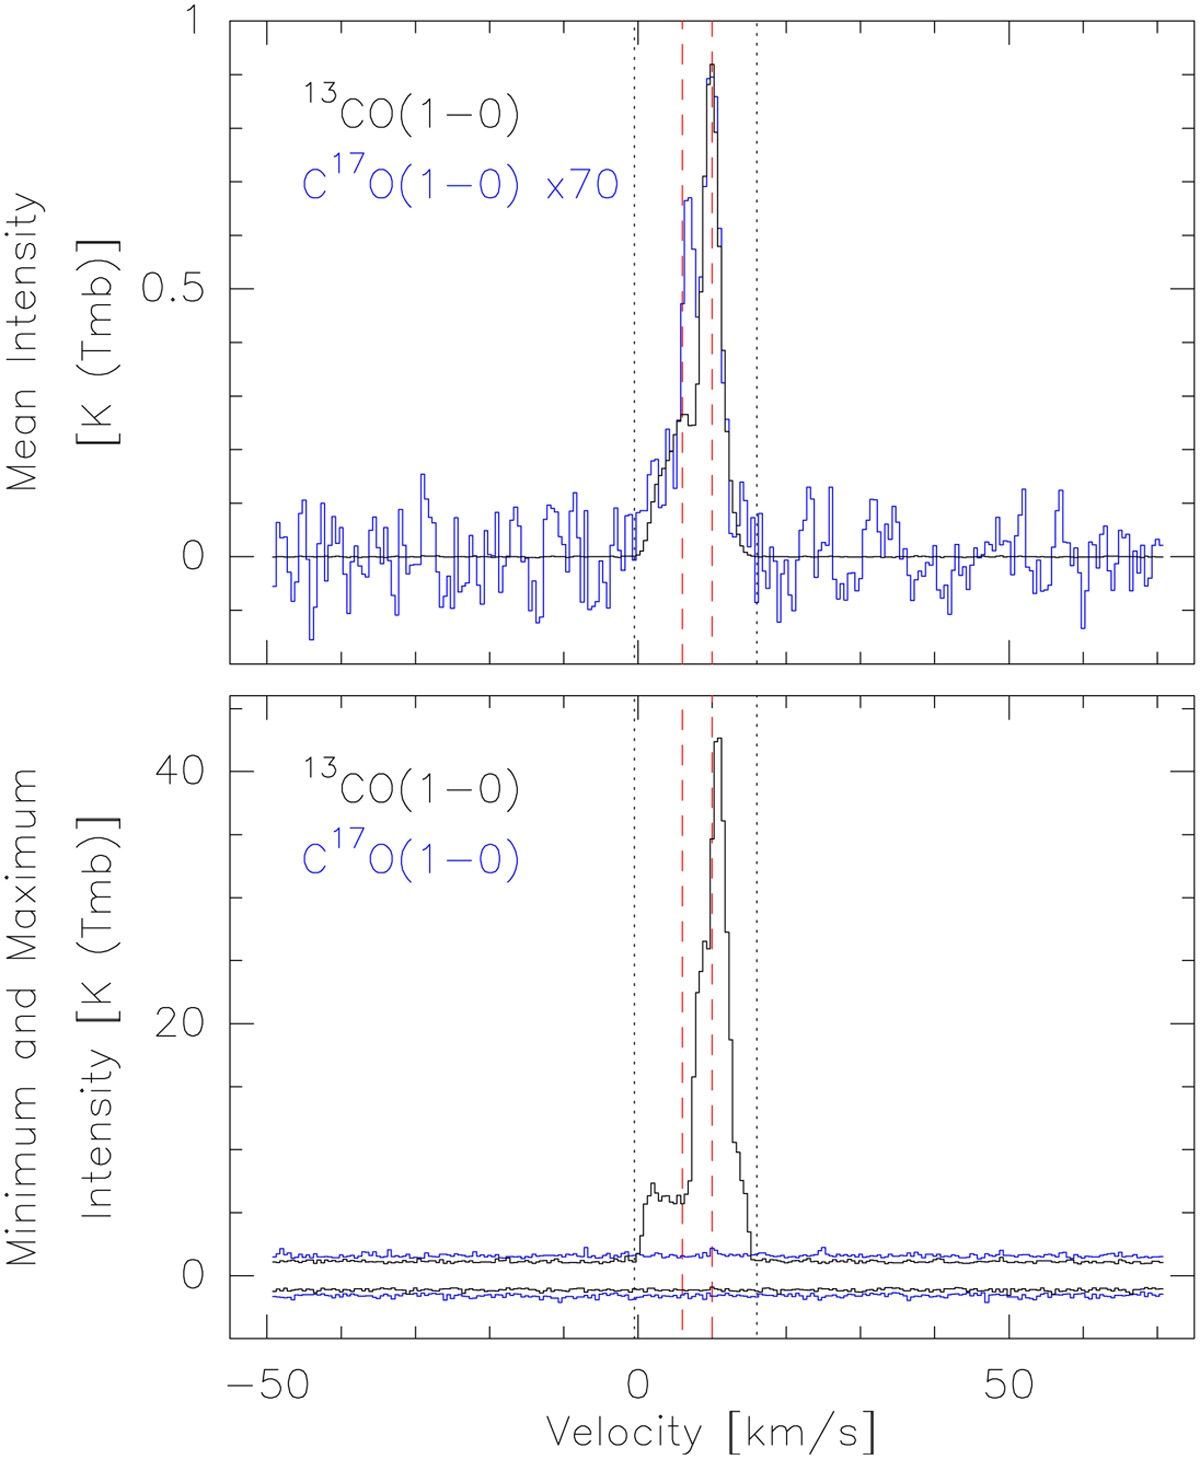
Comparison of intensity spectra between the two radio-astronomy lines. The spectra show the mean (top), minimum and maximum (bottom) intensity as a function of the channel velocity or number. The vertical dashed red lines show the channels whose spatial distribution is plotted on Fig. 4. The vertical dotted lines on the radio-astronomy spectra separate the signal channels from the noise-only ones.
Current usage metrics show cumulative count of Article Views (full-text article views including HTML views, PDF and ePub downloads, according to the available data) and Abstracts Views on Vision4Press platform.
Data correspond to usage on the plateform after 2015. The current usage metrics is available 48-96 hours after online publication and is updated daily on week days.
Initial download of the metrics may take a while.