Fig. 15
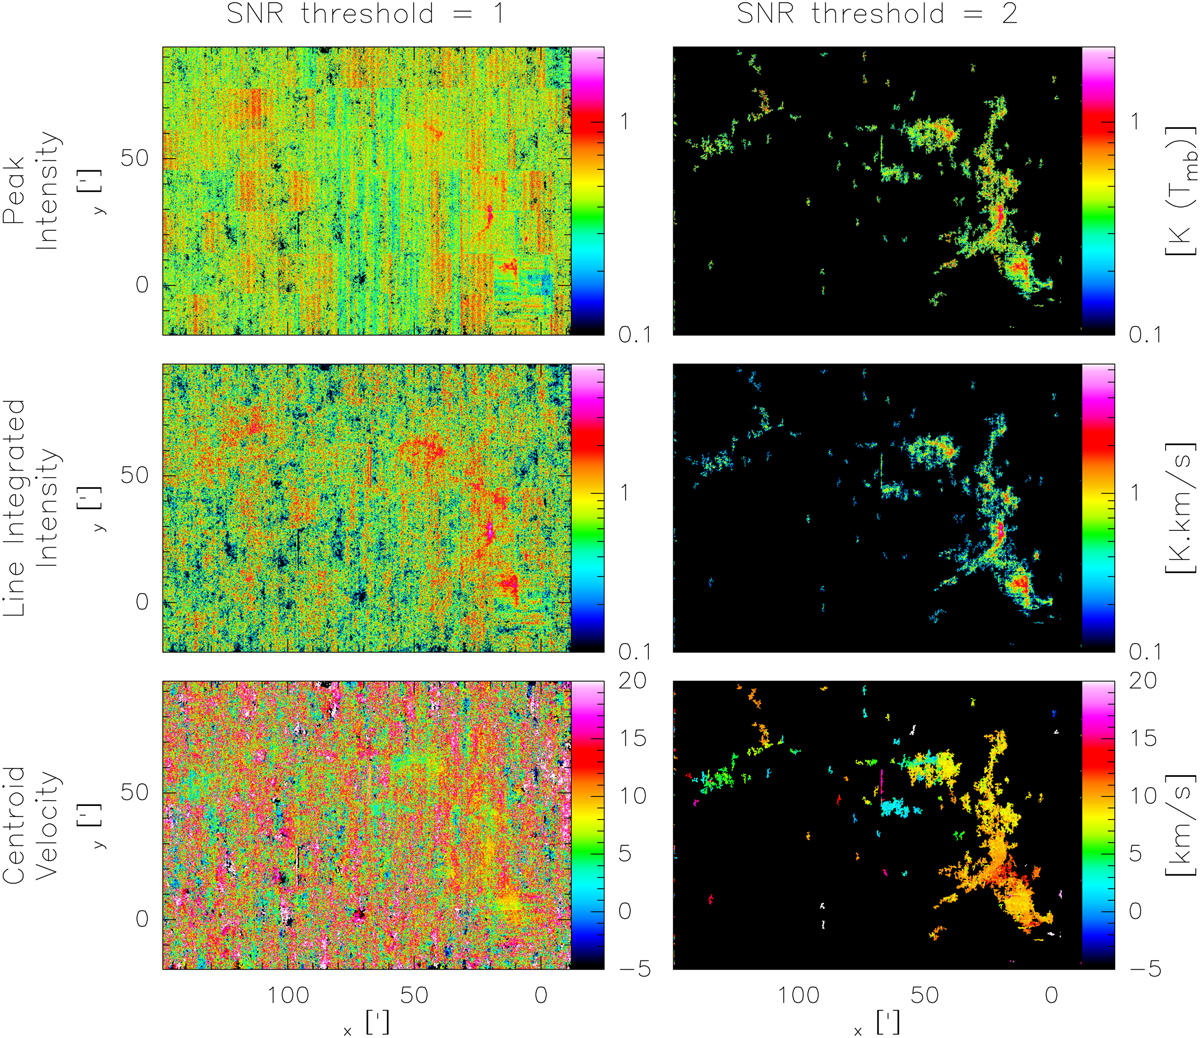
Download original image
Maps of the moments of the spectrum for two different values (1 at left, and 2 at right) of the S/N threshold used to compute the position– position–velocity mask of significant emission. From top to bottom, the peak intensity (maximum of the spectrum), line integrated intensity (moment 0 of the spectrum), and centroid velocity (moment 1 of the spectrum) are shown.
Current usage metrics show cumulative count of Article Views (full-text article views including HTML views, PDF and ePub downloads, according to the available data) and Abstracts Views on Vision4Press platform.
Data correspond to usage on the plateform after 2015. The current usage metrics is available 48-96 hours after online publication and is updated daily on week days.
Initial download of the metrics may take a while.