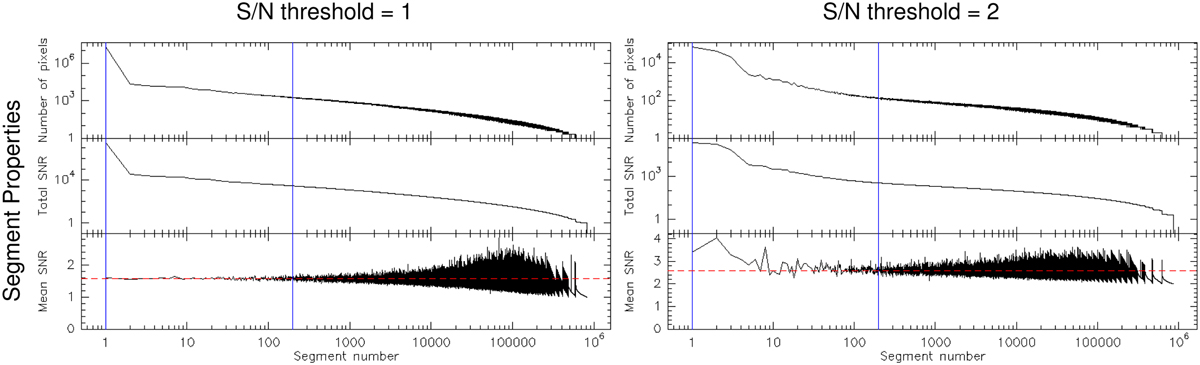
Fig. 14
Download original image
Properties of the segments obtained on the cube of S/N for the C17O (1–0) line. This cube was segmented into contiguous position-position-velocity regions above a minimum S/N value. The segments are ordered by decreasing value of the S/N summed over the segment (total S/N). The shown properties are, from top to bottom, the total number of pixels inside the segment, the total S/N, and the mean S/N of the segment. These properties are shown for two different S/N thresholds: 1 and 2. The blue plain vertical lines show the segments that are selected to compute the moment maps in Fig. 15. The red dashed horizontal lines show the typical mean S/N reached for the segment # 200.
Current usage metrics show cumulative count of Article Views (full-text article views including HTML views, PDF and ePub downloads, according to the available data) and Abstracts Views on Vision4Press platform.
Data correspond to usage on the plateform after 2015. The current usage metrics is available 48-96 hours after online publication and is updated daily on week days.
Initial download of the metrics may take a while.