Fig. 6
Download original image
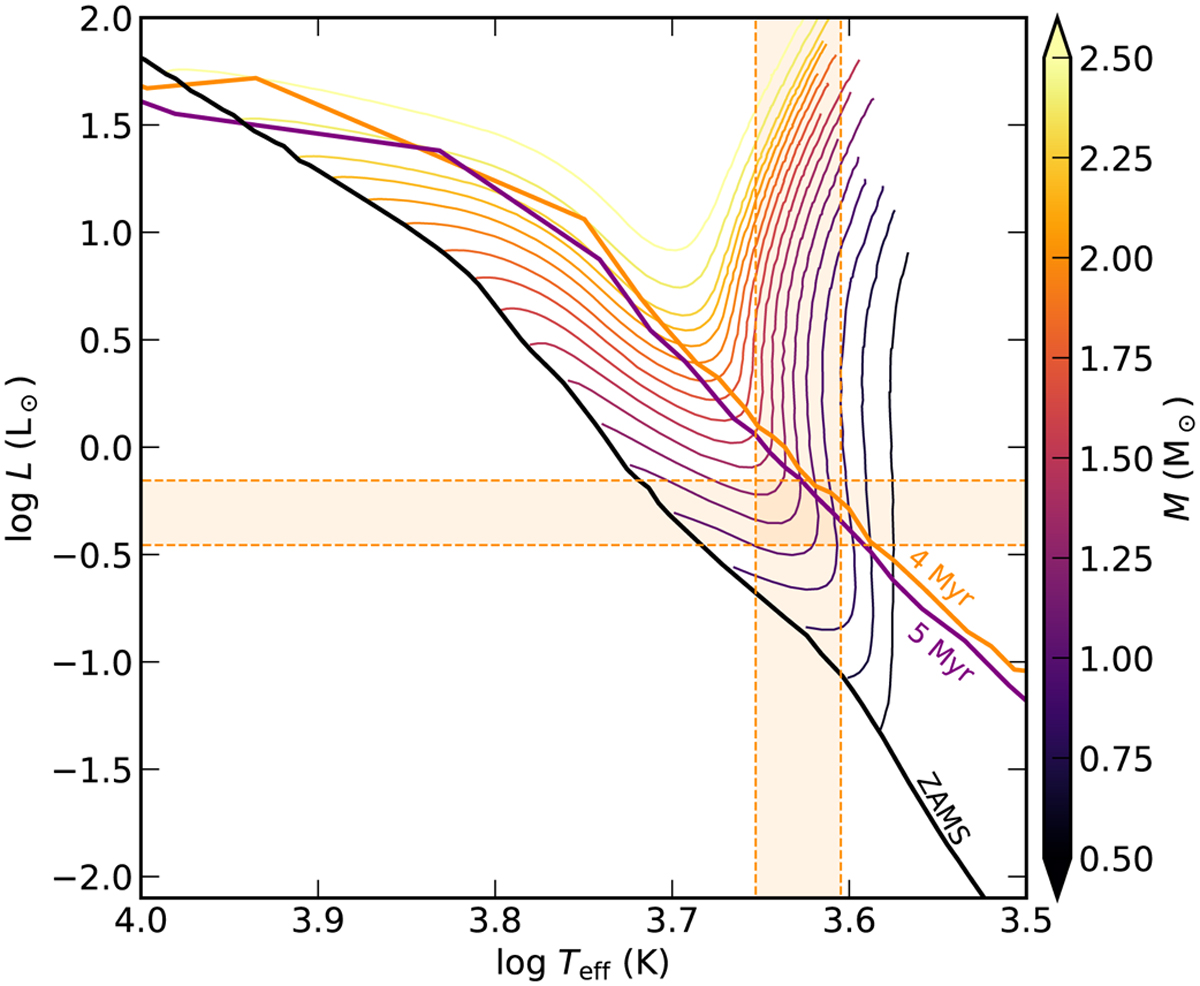
Hertzsprung-Russel diagram with stellar tracks from Siess et al. (2000) for stellar masses from 0.5 to 2.5 M⊙. The orange and purple lines denote the 4 and 5 Myr isochrones. The crosshair points at the range of effective temperature and luminosity found in the MCMC runs, which agrees well with a ∼1 M⊙ star derived from the dynamical fits to the CO emission.
Current usage metrics show cumulative count of Article Views (full-text article views including HTML views, PDF and ePub downloads, according to the available data) and Abstracts Views on Vision4Press platform.
Data correspond to usage on the plateform after 2015. The current usage metrics is available 48-96 hours after online publication and is updated daily on week days.
Initial download of the metrics may take a while.