Fig. 5
Download original image
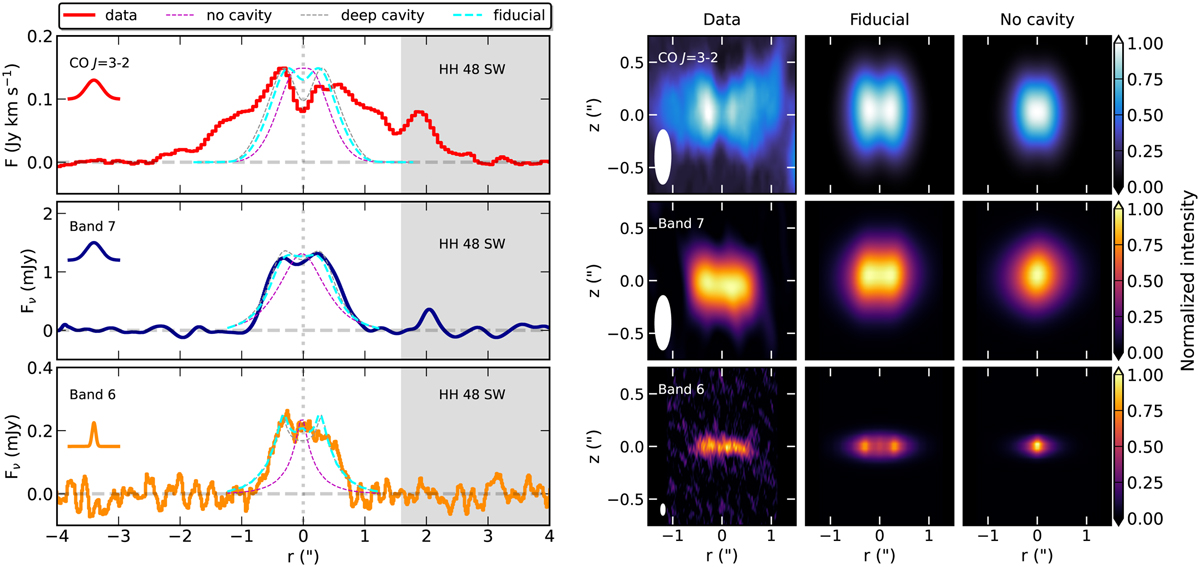
Observed radial profiles of CO and millimeter continuum from ALMA observations compared to models with and without a cavity. Left: radial profile of the CO J = 3−2 integrated emission map (red, top), Band 7 continuum (blue, middle), and Band 6 continuum (orange, bottom). The beam size of the observations in the radial direction is illustrated with a black Gaussian profile in the upper left corner. The modeled emission is shown with a dashed line and is normalized to the peak of the observed profile. The best-fitting or fiducial model is shown in cyan, the best-fitting model without a cavity is shown in purple, a similar model to the best model, but with a cavity that is 100 times more depleted in gas, and dust is shown in gray. The position of HH 48 SW is marked with a gray shaded area. Right: 2D maps of the CO J = 3−2 integrated emission (top), Band 7 continuum (middle), and Band 6 continuum (bottom). Images are rotated by 12 degrees so that the disk is aligned horizontally. From left to right: observations, overall best-fitting model, and best-fitting model without a cavity. The beam sizes of the observations are shown in the lower left corner.
Current usage metrics show cumulative count of Article Views (full-text article views including HTML views, PDF and ePub downloads, according to the available data) and Abstracts Views on Vision4Press platform.
Data correspond to usage on the plateform after 2015. The current usage metrics is available 48-96 hours after online publication and is updated daily on week days.
Initial download of the metrics may take a while.