Fig. 3
Download original image
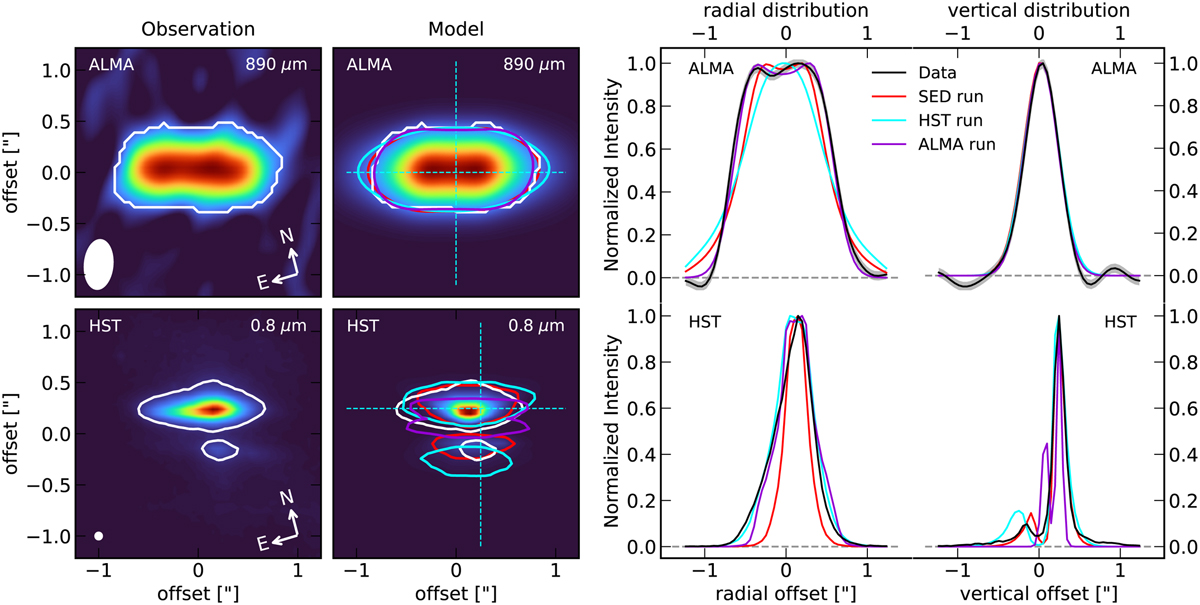
Comparison between the ALMA (890 µm, top) and HST (0.8 µm, bottom) observations with the ray-traced model. Far left: observations of HH 48 NE normalized to the peak emission. The size of the beam/PSF is indicated in the bottom left corner. The white lines trace the 5σ contours of the observations. Center left: best-fitting model at the same wavelengths as the observation, convolved with a model of the beam or PSF. The colored lines trace the same value relative to the peak flux, as the 5σ contour of the observation in the model images for the SED run (red), the HST run (cyan), and the ALMA run (purple). The dashed cyan line illustrates the position of the radial and vertical cuts shown in the right panel. Center right: radial cut through the observations (black) and the three models using the SED (red), the resolved HST observation (cyan), the ALMA observation (purple) (see Sect. 3). The radial cuts are normalized to their respective peak flux. Far right: normalized vertical cut through the data and models as for the radial distribution. The vertical cut through the HST observations is 0.25″ off-center to obtain the highest S/N of the lower lobe.
Current usage metrics show cumulative count of Article Views (full-text article views including HTML views, PDF and ePub downloads, according to the available data) and Abstracts Views on Vision4Press platform.
Data correspond to usage on the plateform after 2015. The current usage metrics is available 48-96 hours after online publication and is updated daily on week days.
Initial download of the metrics may take a while.