Fig. 2
Download original image
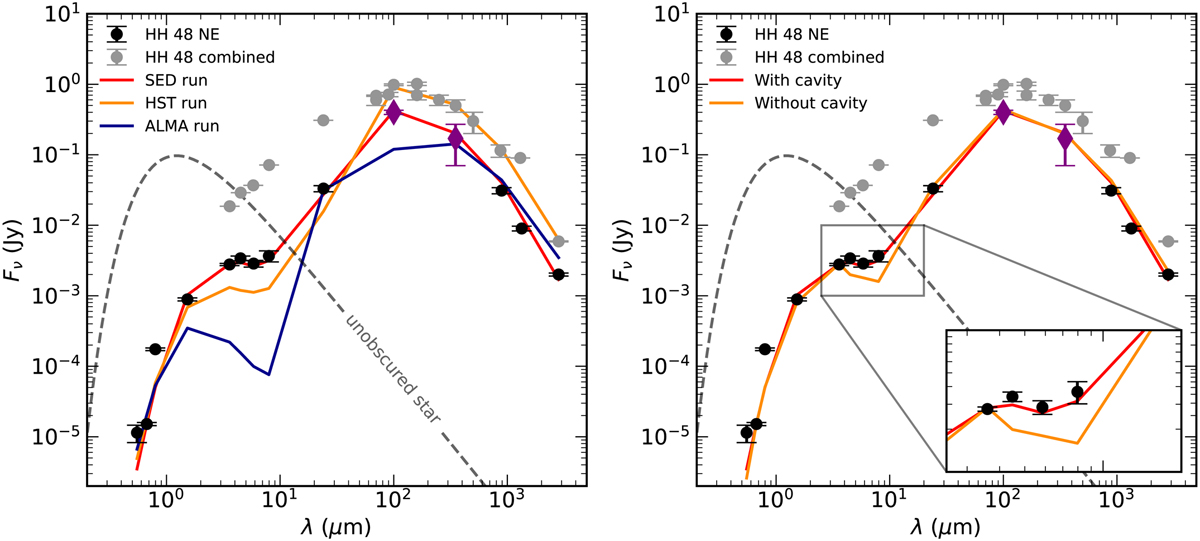
Comparison between the observed and modeled spectral energy distributions of HH 48 NE. Left: observed SED of HH 48 NE (black) and observations for the two components of the binary system combined (gray). The flux values for HH 48 NE are listed in Table 1. The colored lines show the results of the three different MCMC runs described in Sect. 3. The dashed gray line shows the 4155 K stellar input spectrum scaled to a distance of 185 pc. The purple diamonds mark the two points that are scaled from the combined spectrum, as explained in the main text. Right: comparison of the best-fitting model in the SED runs with and without a cavity.
Current usage metrics show cumulative count of Article Views (full-text article views including HTML views, PDF and ePub downloads, according to the available data) and Abstracts Views on Vision4Press platform.
Data correspond to usage on the plateform after 2015. The current usage metrics is available 48-96 hours after online publication and is updated daily on week days.
Initial download of the metrics may take a while.