| Issue |
A&A
Volume 677, September 2023
|
|
|---|---|---|
| Article Number | A47 | |
| Number of page(s) | 9 | |
| Section | Stellar atmospheres | |
| DOI | https://doi.org/10.1051/0004-6361/202345991 | |
| Published online | 01 September 2023 | |
Does the i-process operate at nearly solar metallicity?
1
Department of Physics, University of Calicut,
Thenhipalam,
Malappuram
673635, India
e-mail: This email address is being protected from spambots. You need JavaScript enabled to view it.
2
Institut d’Astronomie et d’Astrophysique, Université Libre de Bruxelles (ULB)
C.P. 226,
1050
Bruxelles, Belgium
e-mail: This email address is being protected from spambots. You need JavaScript enabled to view it.
3
European Southern Observatory,
Alonso de Córdova 3107, Vitacura, Casilla
19001,
Santiago de Chile, Chile
4
Institute of Physics, Laboratory of Astrophysics, École polytechnique fédérale de Lausanne (EPFL), Observatoire de Sauverny,
1290
Versoix, Switzerland
5
Instituut voor Sterrenkunde, KU Leuven,
Celestijnenlaan 200D,
3001
Leuven, Belgium
Received:
25
January
2023
Accepted:
25
April
2023
Abstract
Context. A sample of 895 s-process-rich candidates has been found among the 454 180 giant stars surveyed by LAMOST at low spectral resolution (R ~ 1800). In a previous study, taking advantage of the higher resolution (R ~ 86 000) offered by the HERMES-Mercator spectrograph, we performed a reanalysis of 15 of the brightest stars of this sample. Among these 15 programme stars, which have close-to-solar metallicities, 11 showed mild to strong heavy-element overabundances. However, we did not investigate the nucleosynthetic process(es) at the origin of these overabundances in our former study.
Aims. We derive the abundances in s- and r-process elements of the 15 targets in order to investigate whether some stars also show an i-process signature, as sometimes found in their lower-metallicity counterparts (namely, the carbon-enhanced metal-poor (CEMP)-rs stars).
Methods. Abundances are derived from the high-resolution HERMES spectra for Pr, Nd, Sm, and Eu using the TURBOSPECTRUM radiative-transfer local thermodynamic equilibrium code with MARCS model atmospheres.
Results. Using the new classification scheme proposed in our recent study, we find that two stars show overabundances in both sand r-process elements that are well above the level expected from Galactic chemical evolution (GCE), an analogous situation to that of CEMP-rs stars at lower metallicities. We compare the abundances of the most enriched stars with the nucleosynthetic predictions from the STAREVOL stellar evolutionary code and find abundances compatible with an i-process occurring in asymptotic giant branch stars.
Conclusions. Despite there being a larger number of heavy elements with which to characterize the enrichment pattern, the limit between CEMP-s and CEMP-rs stars remains indistinct. Nevertheless, it is interesting to note that an increasing number of extrinsic stars are found to have abundances better reproduced by an i-process pattern even at close-to-solar metallicities.
Key words: nuclear reactions, nucleosynthesis, abundances / stars: AGB and post-AGB / binaries: spectroscopic
© The Authors 2023
 Open Access article, published by EDP Sciences, under the terms of the Creative Commons Attribution License (https://creativecommons.org/licenses/by/4.0), which permits unrestricted use, distribution, and reproduction in any medium, provided the original work is properly cited.
This article is published in open access under the Subscribe to Open model. This email address is being protected from spambots. You need JavaScript enabled to view it. to support open access publication.
1 Introduction
The origin of the peculiar chemical composition of carbon-enhanced-metal-poor stars enriched in both s and r elements (CEMP-rs stars) is an unsolved problem. Some of the scenarios that have been invoked to explain their overabundances (Jonsell et al. 2006; Masseron et al. 2010; Hampel et al. 2016) include (i) a primordial origin (the pollution of the birth cloud by an r-process source), (ii) pollution of the binary by a third massive star (triple system), (iii) pollution by the primary (type 1.5 supernova or accretion-induced collapse), and finally (iv) the intermediate neutron-capture process or i-process. This nucleosynthesis process leads to neutron densities of the order of Nn ~ 1015 cm−3, which is intermediate between those of the s-process (Nn ~ 108 cm−3) and those required by the r-process (Nn ≫ 1020 cm−3). Recently, Karinkuzhi et al. (2021a) studied a sample of CEMP-s and -rs stars in our Galaxy and suggested that the abundance pattern in CEMP-rs stars can be produced by a thermally pulsing asymptotic giant branch (TP-AGB) star experiencing i-process nucleosynthesis after proton ingestion during its first convective thermal pulse, with this material being transferred to a close-by companion. From a comparison of the abundance profiles of CEMP-s and CEMP-rs stars, Karinkuzhi et al. (2021a) noticed an abundance continuum rather than dichotomic patterns. Therefore, the i-process could be a manifestation of the s-process at low ([Fe/H] ~ −2) metallicities, when proton injection takes place. Our previous identification and analysis (Karinkuzhi et al. 2018) of a star enriched in s and r elements at higher metallicity ([Fe/H] ~ 0.7) hint at an i-process not limited to metal-poor environments. The literature contains other pieces of evidence in line with this hypothesis, such as the barium star subsamples of Cui et al. (2014) and den Hartogh et al. (2023), and the born-again phase of the Sakurai’s object, which also seems to display an i-process pattern (Herwig et al. 2011). These observations suggest it may be possible for a given object to produce this rs pattern without resorting to a “two-event” scenario (independent and cumulative pollution episodes by an r-process and an s-process).
In this paper, we use a sample of 15 stars from Norfolk et al. (2019) reanalyzed in Karinkuzhi et al. (2021b, hereafter K21) to check for potential hybrid profiles at close-to-solar metallicities. This paper is organized as follows. Section 2 describes the sample selection and Sect. 3 the method used to derive the atmospheric parameters and abundances. In Sect. 4 we classify the stars on the basis of their [s/r] ratio, while in Sect. 5 we use a classification based on a larger number of heavy elements. Section 6 presents AGB models and nucleosynthesis reproducing the measured abundances with an i-process triggered by a proton-injection episode (PIE) very similar to the one found in metal-poor stellar models. In Sect. 7 we show that the i-process provides better agreement with the measured abundances than a superposition of two independent s and r pollution episodes. Conclusions are presented in Sect. 8.
2 Sample selection
Our sample consists of 15 bright barium stars selected from the 895 objects from Norfolk et al. (2019) and for which high-resolution HERMES (Raskin et al. 2011) spectra are available. A first analysis of this sample was presented in K21. The metallicities range from [Fe/H] = 0.02 to −0.61. Among the 15 programme stars, 4 show no s-process overabundances ([X/Fe] < 0.2 dex), 8 show mild s-process overabundances (at least three heavy elements with 0.2 ≤ [X/Fe] < 0.8), and 3 have strong overabundances (at least three heavy elements with [X/Fe] ≥ 0.8), as listed in Table 1.
The binarity of these stars was investigated by K21 from which it appears that 2 out of the 3 strong barium stars show a clear binary signature from radial-velocity (RV) variations. The results for the other classes are intriguing, because only 1 out of the 8 mild barium stars diagnosed exhibits statistically significant RV variations, and on the contrary, 2 out of the 4 “no-s” stars show a binary signature.
3 Derivation of atmospheric parameters and abundances
The derivation of atmospheric parameters is presented in K21, but the stellar parameters are repeated here (Table 1). Abundances were derived through spectral synthesis using the local thermodynamic equilibrium (LTE) TURBOSPECTRUM code (Alvarez & Plez 1998). We used solar abundances from Asplund et al. (2009) and the line lists of Heiter et al. (2015); Heiter (2020) as in Karinkuzhi et al. (2018, 2021a). Table A.1 presents the derived Pr, Nd, Sm, and Eu abundances, while we refer to Tables A.1 and A.2 of K21 for the remaining abundances. The complete abundance profiles are also presented in Figs. B.1 and B.2. Mashonkina et al. (2000) and Mashonkina & Christlieb (2014) studied the non-LTE (NLTE) corrections for the Eu II 6645.135 Å line and showed that they are negligible (≈0.06 to 0.08 dex for metallicities higher than −3.0). For the other elements, we were not able to find information about NLTE corrections at the metallicities of our objects. The isotopic shifts and hyperfine splitting (HFS) of the atomic lines were included while deriving the Eu abundances. For other elements, the isotopic shifts and HFS splitting are not available for the lines we used. Figure 1 presents the spectral fitting of Eu lines in a few sample stars. Though many Nd lines are available throughout the spectral coverage, we used the Nd II lines in the range 5200–5400 Å because these are relatively free from molecular blends. For Pr and Sm, we used all the measurable lines as listed in Karinkuzhi et al. (2018, 2021a). Details of the error estimates are presented in K21. Table 2 presents the changes in the abundances resulting from variation of the atmospheric parameters Teff, log ɡ, micro-turbulence ξ, and [Fe/H] by 100 K, 0.5, 0.5 km s−1, and 0.5 dex, respectively. The final errors are calculated using Eqs. (1) and (2) of K21 and are presented in Table A.1.
4 Classification based on [Ba/Eu] and [La/Eu] abundance ratios
Various abundance thresholds have been used for the classification of CEMP-s and -rs stars (see discussion in Sect. 5 of Karinkuzhi et al. 2021a). Figures 2 and 3 present typical (s,r) planes using lanthanum and barium as the prototype s-element, respectively, and europium as a representative r-element. The different colored regions correspond to commonly accepted limits (Beers & Christlieb 2005) for CEMP-s stars ([Ba/Eu] or [La/Eu] > 0.5, blue region), CEMP-rl stars ([Ba/Eu] or [La/Eu] < 0, 0 < [Eu/Fe] < +1, light green region), and CEMP-rII stars ([Ba/Eu] or [La/Eu] < 0, [Eu/Fe] > +1, dark green region). Finally, the intermediate region between the blue CEMP-s and the green CEMP-r regions has been colored in red. A growing number of stars enriched in both r and s elements (CEMP-rs) has been found in the past decade to occupy this region. In Figs. 2 and 3, CEMP-r, -s, and -sr stars from Masseron et al. (2010), and Karinkuzhi et al. (2021a) are shown as green, blue, and red dots, respectively. In addition, barium stars analyzed by Roriz et al. (2021, for which the barium abundance is not available) are plotted as small blue crosses in Fig. 2.
The majority of barium stars analyzed by Roriz et al. (2021) and also the majority of CEMP-s stars are located in the blue-shaded region, as expected. However, we note that especially at low enrichment levels ([La/Fe] and [Eu/Fe] < 0.7), many barium and CEMP-s stars occupy the red-shaded region. Actually, if the enrichment is low, the pristine composition might not be erased by the pollution from the companion and the current abundance profile might also reflect an enrichment due to Galactic chemical evolution. Alternatively, the abundances could be biased because of the difficulty in determining weak line abundances in blended spectra1.
The 15 stars of the current sample are identified in Fig. 2 with black symbols surrounding the corresponding dots: black crosses for the “no s-process enrichment”, black squares for the “mild enrichment”, and plus symbols for the “strong enrichment” of Table 1. Interestingly, these stars all fall in the CEMP-rs (red) or r-I (green) regions. This is reminiscent of the barium stars analyzed by den Hartogh et al. (2023): these authors detect the signature of an i-process activation in about 25% of the evolved companions of the barium star.
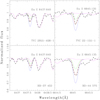 |
Fig. 1 Spectral fitting of the 6437.640 and 6645.135 Å EuII lines for four sample stars. Red lines correspond to spectral syntheses with the abundance for Eu listed in Table A.1. Blue and green lines represent syntheses with abundances deviating by ±0.3 dex from the adopted abundance. The magenta line corresponds to the synthesis with a null abundance for Eu. |
Sensitivity of the abundances (Δ log ϵX) with variations of the atmospheric parameters (considering the atmospheric parameters of BD −07° 402).
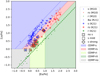 |
Fig. 2 [La/Fe] as a function of [Eu/Fe], The figure includes CEMP-s stars, CEMP-rs stars, and r-process-enriched stars from Masseron et al. (2010) and Karinkuzhi et al. (2021 a) as well as the Ba stars of Roriz et al. (2021). The dashed green line corresponds to abundance-ratio scaling with a pure solar r-process (Goriely 1999), whereas the continuous blue line corresponds to s-process nucleosynthesis abundance ratio scaling with the predictions from the fifth pulse of a 1.5 M⊙ star at [Fe/H] = −1. |
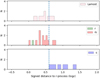 |
Fig. 4 Histogram of the signed distance (Eq. (1)) of the star samples. Upper panel: star sample of the present study (considering only those with mild and strong enrichments, meaning 11 stars out of 15). Middle panel: Karinkuzhi et al. (2021a) sample of CEMP-rs (red) and -r (green) stars. Lower panel: Karinkuzhi et al. (2021a) sample of CEMP-s stars. The dashed line represents the dS = 0.6 limit between CEMP-s and CEMP-rs stars, as defined in Karinkuzhi et al. (2021a). |
5 Classification based on s- and r- elements
We used seven elemental abundances (Y, Zr, Ba, La, Ce, Nd, Sm) to compute a signed distance to a reference abundance pattern, which was chosen to be the solar r-process scaled to the europium abundance of the star (see Eq. (3) of Karinkuzhi et al. 2021a):
 (1)
(1)
where {x1…xN} are the N considered heavy elements, and we employ the commonly used notation  , with nXi being the number density of element xi. We denote
  the abundance of element Xi for the program stars, and
  the standard r-process abundance profile
  normalized to the star abundance profile with respect to europium:
 (2)
(2)
where the adopted r-process abundances  are listed in Table B.4 of Karinkuzhi et al. (2021a). Figure 4 presents the histogram of this signed distance together with the limit adopted in Karinkuzhi et al. (2021a) to separate CEMP-s from CEMP-rs stars (at dS = 0.6). This limit is certainly somewhat arbitrary. However, Fig. 4 shows that most of our sample stars strongly enriched in heavy elements appear to have an rs pattern.
6 Comparison with nucleosynthesis predictions
We computed AGB nucleosynthesis predictions by coupling the STAREVOL code (Siess & Arnould 2008) with an extended reaction network of 1160 species linked by 2123 nuclear reactions. More details on the nuclear network and input physics can be found in Choplin et al. (2021) and Goriely et al. (2021). The solar abundances are taken from Asplund et al. (2009), which correspond to a metallicity of Z = 0.0134. The Reimers (1975) mass-loss rate with ηR = 0.4 is used from the main sequence up to the end of core helium burning and that of Vassiliadis & Wood (1993) is used during the AGB phase. We computed dedicated models with an initial mass of 2 M⊙ and a metallicity of [Fe/H] = −0.5, which is close to the metallicity derived from the observations as explained below.
In the present calculations, a diffusion equation is used to compute the partial mixing of protons in the C-rich layers at the time of the third dredge up (TDU). We follow Eq. (9) of Goriely & Siess (2018) and use in our standard case the same diffusive mixing parameters in our simulations as in Shetye et al. (2019), namely ƒenv = 0.14, Dmin = 107cm2 s−1, and p = 1/2, where ƒenv controls the extent of the mixing, Dmin the value of the diffusion coefficient at the base of the envelope, and p is a free parameter describing the shape of the diffusion profile. In addition to this diffusive mixing at the base of the envelope, a similar prescription is applied at the top of the thermal pulse, where a coefficient ƒpulse governs the diffusive transport. Two different values of the ƒpulse coefficient, triggering an s-process or i-process nucleosynthesis, are considered here, as explained below.
When considering a relatively weak diffusive mixing at the top of the thermal pulse characterized by ƒpulse = 0.03, the AGB phase of our 2 M⊙ [Fe/H] = −0.5 model star is found to follow a standard evolution with the occurrence of eight thermal pulses and a regular surface enrichment at the time of the TDU. In addition, the diffusive mixing at the bottom of the envelope gives rise to a radiative s-process during the interpulse phases similar to what is found in Goriely & Siess (2018). The corresponding abundance pattern found at the surface at the end of the AGB evolution is illustrated in Fig. 5 (blue curve).
The ingestion of protons in the convective helium-burning zone can lead to a rich i-process nucleosynthesis that can explain the surface enrichment of CEMP-rs stars relatively successfully (e.g., Hampel et al. 2019; Karinkuzhi et al. 2021a; Choplin et al. 2021). However, as detailed in Choplin et al. (2022), when no extra mixing is included, the PIE is restricted to model stars of metallicity lower than typically [Fe/H] ~ −2. When considering diffusive mixing below the envelope and at the top of the thermal pulse, it is found that a possible PIE can be triggered in a way very similar to those found in very metal-poor stars. In particular, mixing parameters ƒenv = 0.06 and ƒpulse = 0.06 lead to a PIE at the time of the third thermal pulse, with a maximum neutron density reaching 1014cm−3. The resulting surface abundance distribution is shown in Fig. 5 (red profile) and is rather similar to the one obtained in low-metallicity stars (Choplin et al. 2022).
In summary, depending on the strength of the overshoot mixing imposed both at the bottom of the envelope and at the top of the pulse, either a standard s-process or an i-process can be simulated in a 2 M⊙ [Fe/H] = −0.5 model star. Despite progress in multi-dimensional simulations of convective boundary mixing (e.g., in low-mass stars, Mocák et al. 2011; Herwig et al. 2014; Woodward et al. 2015), no firm conclusions can be drawn as to the strength of the mixing. Our approach is to explore these possibilities and compare our results with the present observations.
We pay particular attention to the most strongly enriched s-process stars of Table 1, because their abundances must reflect genuine pollution and not the chemical enrichment of the Galaxy, contrarily to the situation that might prevail for stars with weak enrichments. In particular, TYC 2250–1047–1 and TYC 591–1090–1 show an [Eu/Fe] of 0.88 and 0.93 dex, respectively, which cannot be explained by Galactic chemical evolution alone. Very few stars are found with [Eu/Fe] > 0.4 among disk stars with [Fe/H] > −0.4 (Tautvaišienė et al. 2021; Van der Swaelmen et al. 2023). Therefore, the abundance pattern of these two stars must result from extra pollution(s). TYC 2955–408–1, with [Eu/Fe] = 0.52, is difficult to classify and the abundances of additional elements are needed to decide whether it is an i-process star or a barium star with a europium abundance corresponding to the high-europium tail of the Galactic distribution. A comparison of their measured and predicted abundances is given in Fig. 6, where a dilution factor is applied to the surface abundances shown in Fig. 5 to match the overabundances observed in the La-Ba region. This dilution factor is required to simulate the mixing of the nucleosynthesis yields from the primary star onto its companion (assumed to be of the same initial composition).
The overall accuracy of the model predictions can be quantified for each star through the reduced χ2 indicator:
![Mathematical equation: ${\chi ^2} = {1 \over N}\sum\limits_X {{{{{\left( {{{\left[ {{{\rm{X}} \mathord{\left/ {\vphantom {{\rm{X}} {{\rm{Fe}}}}} \right. \kern-\nulldelimiterspace} {{\rm{Fe}}}}} \right]}_{{\rm{obs}}}} - {{\left[ {{{\rm{X}} \mathord{\left/ {\vphantom {{\rm{X}} {{\rm{Fe}}}}} \right. \kern-\nulldelimiterspace} {{\rm{Fe}}}}} \right]}_{\bmod }}} \right)}^2}} \over {\sigma _{{\rm{X,obs}}}^2}},}$](/articles/aa/full_html/2023/09/aa45991-23/aa45991-23-eq8.png) (3)
(3)
where [X/Fe]obs and [X/Fe]mod are respectively the measured and predicted abundances of a given element X, and σX,obs is the associated uncertainty on the measured abundance. We consider the N = 10 elements available in all stars, namely Sr, Y, Zr, Ba, La, Ce, Pr, Nd, Sm, and Eu.
We report a typo in Eq. (6) of Karinkuzhi et al. (2021a), where the normalizing factor 1/N was erroneously omitted, though it was included when computing the χ2 listed in the Table 1 of that paper (see Corrigendum in Karinkuzhi et al. 2023). Equation (3) above is the correct expression used to provide the numbers given in the tables of both papers.
In Karinkuzhi et al. (2021a), reduced χ2 values for CEMP-s stars (when compared to an s-process) ranged between 2.7 and 10.9. Similarly, reduced χ2 values for CEMP-rs stars (when compared to an i-process) ranged between 1.3 and 10.6. Here, for the two most enriched stars (TYC 2250-1047-1 and TYC 591–1090–1), we find a reduced χ2 of between 6.4 and 7.6 (depending on the exact number (8 or 10) of considered chemical elements, but including Eu; see Table 3) when comparing to an i-process, but in the range between 11.2 and 23.7 when comparing to an s-process. The chemical pattern of these two most-enriched stars is therefore better reproduced by an i-process than by an s-process.
We note that the first peak s-process element abundances (Sr, Y, Zr) are always difficult to reproduce (either by an s- or i-process; Fig. 6), and this strongly impacts the χ2. The results from the χ2 are therefore less clear with the seven elements than with a metric using eight (i.e., including Eu) or ten elements (including Sr, Pr and Eu). Considering Eu in addition to Sm is therefore crucial when assessing an i- or r- contribution. We note that of these two stars, only TYC 2250–1047–1 is classified as rs-enriched according to the signed distance criterion (dS <0.6). The reason for this partially lies in the fact that the 0.6 threshold on the signed distance is a somewhat arbitrary value and, as seen in Fig. 4, values up to dS = 0.75 might still be encountered for some CEMP-rs stars falling in the intermediate (red) regions of Figs. 2 and 3.
In summary, in this paper we use two different indicators to assess the s- or i-character of a measured stellar abundance profile: the distance indicator (using seven heavy elements plus Eu, which serves to normalize the measured Eu abundance to the solar-scaled “universal” r-process abundance; this has the advantage of being model-independent) and the reduced χ2 (computed between the measured profile and a nucleosynthetic prediction, either s or i). Table 3 shows that these two indicators are consistent when the comparison is based on the same set of chemical elements, as can be seen by comparing the reduced χ2 for seven elements (6.0, 2.6) and the dS distance, which uses the same seven elements (0.63, 0.56) for the two stars (TYC 591–1090–1, TYC 2250–1047–1), ordered by increasing contribution of an i-process. The eight and ten-element χ2 show that including Sr as well as Pr and Eu is very important in order to obtain clearly different s-process χ2 and i-process χ2, and therefore to obtain a clear diagnostic concerning the s- or rs-character of the abundance profile.
We demonstrate in the next section that replacing the i-process pattern with any superposition of two independent sand r-pollutions deteriorates the agreement with the measured abundances.
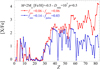 |
Fig. 5 Comparison of the final elemental surface distributions [X/Fe] (solid lines) obtained after the development of the neutron-capture processes in a 2 M⊙ AGB star of metallicity [Fe/H] = −0.5. The blue line is obtained with diffusive mixing characterized by ƒenv = 0.14 and ƒenv = 0.03, which gives rise to s-process nucleosynthesis, while the red line results from mixing with ƒenv = 0.06 and ƒpulse = 0.06 leading to a PIE, i.e., to a i-process nucleosynthesis. |
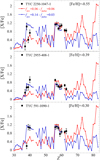 |
Fig. 6 Comparison of the measured abundances with nucleosynthesis predictions from the STAREVOL code. The abundances obtained at the surface of the 2 M⊙ [Fe/H] = −0.5 model with two different sets of the diffusive mixing parameters, (the blue line corresponding to an s-process, and the red line to an i-process) as shown in Fig. 5, are compared with the abundances of the 3 most enriched barium stars (black squares). |
Reduced χ2 computed either (i) on the same seven elements (Y, Zr, Ba, La, Ce, Nd, Sm) as for the signed or RMS distances (where Eu is used as a normalizing element), (ii) based on the previous elements plus Eu, or (iii) based on the ten elements (Sr, Y, Zr, Ba, La, Ce, Pr, Nd, Sm, and Eu) with derived abundances in the present paper.
7 Testing the scenario of two independent pollution episodes
To check that the abundance patterns of the two i-process stars, TYC 2250–1047–1 and TYC 591–1090–1, are better fitted with an i-process than with a superposition of two independent pollution episodes, one by an s-process and another one by an r-process, we performed the following test. A mixed r+s profile was added to a solar abundance profile scaled to the metallicity of the considered star. The r+s profile was built summing an r- and an s-contribution, each one varied independently from zero to values producing overabundances largely exceeding the measured abundances. We assume a solar-like pattern for the r-process (Table B.4 of Karinkuzhi et al. 2021a) and an AGB pattern for the s-process at the corresponding stellar metallicity (blue line in Fig. 6; see also Goriely & Siess 2018). The agreement between the resulting abundance profile (plotted in faded colors in Fig. 7) and the measured profile was quantified by computing a χ2 as in Eq. (3). For the two stars, a pure s-process produces better agreement with the measured abundances than an r+s mixture. An r-process contribution is never favored because the slope of the r-process is quite steep (i.e., it is more rapidly decreasing with increasing Z than the s-process), and so matching the high europium (as well as samarium) abundances would inevitably lead to significant overestimation of the light-s (Sr, Y, Zr) abundances. The resulting  (between the s-profile and the measured abundances) is very similar to the
  (between the i-proflle and the measured abundances), but the s-proflle never explains the high europium abundance measured in TYC 2250–1047–1 and TYC 591–1090–1. The present analysis indicates that these two enriched stars are better explained by an i-process than by a superposition of two independent s and r processes.
Some deviations between the measured and i-process abundances can still be noted, in particular for light s-elements, but also for Eu, which, in contrast to Sm, tends to be underestimated by the model. The absence of an odd–even effect between the measured Sm and Eu abundances is puzzling.
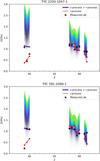 |
Fig. 7 Comparison of the measured abundance profiles (black squares) with a series of synthetic profiles made by a superposition of s- (as plotted in blue in Fig. 6) and r-process profiles, both varied independently and continuously from a solar-scaled profile with a very low s+r enrichment (purple faded lines) to large s+r enrichments (green faded lines). The synthetic “s+r” profile best matching the measured abundances is plotted as a thick violet line. For both stars, this latter corresponds to a pure s-process contribution (therefore, any r-process contribution would deteriorate the agreement regardless of the s-process contribution). For reference, the i-process profile best matching the measured abundances is plotted in red as in Fig. 6. |
8 Conclusions
Our reanalysis of 15 stars classified as s-process-enriched by Norfolk et al. (2019) indicates that their abundances seem to be rather characterized by a hybrid sr pattern rather than by a pure s-process pattern, as inferred from the distance indicator which quantifies the deviation of the star’s abundance profile from a pure r-process distribution. For the two most enriched stars of our sample (which have [Eu/Fe] ≳ 0.75 and cannot be explained by Galactic chemical evolution models), the comparison of the abundance profile with detailed calculations shows that an i-process nucleosynthesis (resulting from the occurrence of a PIE) is a better fit to the observed abundances than a pure s-process or than any combination of r- and s-patterns. At low enrichment levels, the primordial composition resulting from the galactic chemical evolution blurs the picture. This can be seen in Fig. 2, where the barium stars enter the r+s region below [s/Fe] = 0.5 dex.
It is possible that a non-negligible fraction of the stars previously identified as barium stars (because barium enhancement is relatively easy to identify) also present an r-element enrichment, but it is only recently that r-element abundances have been systematically investigated among barium stars. A population of rs-enriched objects (with [La/Eu] < 0.5) seems to emerge, not only at low-metallicities where it was first noticed (among CEMP-rs stars), but also at close-to-solar metallicities, as also found in other samples of barium stars (Karinkuzhi et al. 2018; den Hartogh et al. 2023) and in Sakurai’s object (Herwig et al. 2011; van Hoof et al. 2017). If the i-process is indeed active in objects such as AGB stars of close-to-solar metallicity, important impacts on nucleosynthesis and galactic chemical evolution can be expected. In particular, the i-process contribution to our Solar System would need to be revisited.
Acknowledgements
D.K. acknowledges the financial support from University of Calicut through seed money grant with file number U.O.No.14449/2022/Admn. S.V.E. thanks the Fondation ULB for its support. The Mercator telescope is operated thanks to grant number G.0C31.13 of the FWO under the “Big Science” initiative of the Flemish governement. Based on observations obtained with the HERMES spectrograph, supported by the Fund for Scientific Research of Flanders (FWO), the Research Council of KU Leuven, the Fonds National de la Recherche Scientifique (F.R.S.- FNRS), Belgium, the Royal Observatory of Belgium, the Observatoire de Genève, Switzerland and the Thüringer Landessternwarte Tautenburg, Germany. L.S. and S.G. are senior research associates from F.R.S.- FNRS (Belgium). This work was supported by the F.R.S.- FNRS Grant No IISN 4.4502.19.
Appendix A Individual abundances
Table A.1 lists the elemental abundances.
Elemental abundances
Appendix B Abundance pattern in program stars
Figures B.1 and B.2 show the abundance patterns for stars showing no, mild, or strong s-process enrichment. Figure 3 displays the ([Ba/Fe], [Eu/Fe]) diagram.
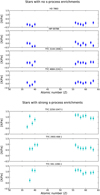 |
Fig. B.1 Abundance profiles of the program stars color coded according to the adopted classification criteria. The upper panel shows the abundance pattern in stars with no s-process enhancements. The lower panel shows the abundance pattern in three stars with strong s-process enrichments. |
References
- Alvarez, R., & Plez, B. 1998, A&A, 330, 1109 [NASA ADS] [Google Scholar]
- Asplund, M., Grevesse, N., Sauval, A. J., & Scott, P. 2009, ARA&A, 47, 481 [NASA ADS] [CrossRef] [Google Scholar]
- Beers, T. C., & Christlieb, N. 2005, ARA&A, 43, 531 [NASA ADS] [CrossRef] [Google Scholar]
- Choplin, A., Siess, L., & Goriely, S. 2021, A&A, 648, A119 [NASA ADS] [CrossRef] [EDP Sciences] [Google Scholar]
- Choplin, A., Siess, L., & Goriely, S. 2022, A&A, 667, A155 [NASA ADS] [CrossRef] [EDP Sciences] [Google Scholar]
- Cui, W. Y., Zhang, B., Shi, J. R., et al. 2014, A&A, 566, A16 [NASA ADS] [CrossRef] [EDP Sciences] [Google Scholar]
- den Hartogh, J. W., Yagüe López, A., Cseh, B., et al. 2023, A&A, 672, A143 [NASA ADS] [CrossRef] [EDP Sciences] [Google Scholar]
- Goriely, S. 1999, A&A, 342, 881 [NASA ADS] [Google Scholar]
- Goriely, S., & Siess, L. 2018, A&A, 609, A29 [NASA ADS] [CrossRef] [EDP Sciences] [Google Scholar]
- Goriely, S., Siess, L., & Choplin, A. 2021, A&A, 654, A129 [NASA ADS] [CrossRef] [EDP Sciences] [Google Scholar]
- Hampel, M., Stancliffe, R. J., Lugaro, M., & Meyer, B. S. 2016, ApJ, 831, 171 [Google Scholar]
- Hampel, M., Karakas, A. I., Stancliffe, R. J., Meyer, B. S., & Lugaro, M. 2019, ApJ, 887, 11 [Google Scholar]
- Heiter, U. 2020, IAU General Assembly, 458 [Google Scholar]
- Heiter, U., Lind, K., Asplund, M., et al. 2015, Phys. Scr, 90, 054010 [CrossRef] [Google Scholar]
- Herwig, F., Pignatari, M., Woodward, P. R., et al. 2011, ApJ, 727, 89 [Google Scholar]
- Herwig, F., Woodward, P. R., Lin, P.-H., Knox, M., & Fryer, C. 2014, ApJ, 792, L3 [NASA ADS] [CrossRef] [Google Scholar]
- Jonsell, K., Barklem, P. S., Gustafsson, B., et al. 2006, A&A, 451, 651 [NASA ADS] [CrossRef] [EDP Sciences] [Google Scholar]
- Karinkuzhi, D., Van Eck, S., Jorissen, A., et al. 2018, A&A, 618, A32 [NASA ADS] [CrossRef] [EDP Sciences] [Google Scholar]
- Karinkuzhi, D., Van Eck, S., Goriely, S., et al. 2021a, A&A, 645, A61 [EDP Sciences] [Google Scholar]
- Karinkuzhi, D., Van Eck, S., Jorissen, A., et al. 2021b, A&A, 654, A140 [NASA ADS] [CrossRef] [EDP Sciences] [Google Scholar]
- Karinkuzhi, D., Van Eck, S., Goriely, S., et al. 2023, A&A, 671, C8 [NASA ADS] [CrossRef] [EDP Sciences] [Google Scholar]
- Mashonkina, L., & Christlieb, N. 2014, A&A, 565, A123 [NASA ADS] [CrossRef] [EDP Sciences] [Google Scholar]
- Mashonkina, L. I., Shimanskiǐ, V. V., & Sakhibullin, N. A. 2000, Astron. Rep., 44, 790 [NASA ADS] [CrossRef] [Google Scholar]
- Masseron, T., Johnson, J. A., Plez, B., et al. 2010, A&A, 509, A93 [NASA ADS] [CrossRef] [EDP Sciences] [Google Scholar]
- Mocák, M., Siess, L., & Müller, E. 2011, A&A, 533, A53 [NASA ADS] [CrossRef] [EDP Sciences] [Google Scholar]
- Norfolk, B. J., Casey, A. R., Karakas, A. I., et al. 2019, MNRAS, 490, 2219 [NASA ADS] [CrossRef] [Google Scholar]
- Raskin, G., van Winckel, H., Hensberge, H., et al. 2011, A&A, 526, A69 [CrossRef] [EDP Sciences] [Google Scholar]
- Reimers, D. 1975, Mem. Soc. Roy. Sci. Liège, 8, 369 [Google Scholar]
- Roriz, M. P., Lugaro, M., Pereira, C. B., et al. 2021, MNRAS, 507, 1956 [NASA ADS] [CrossRef] [Google Scholar]
- Shetye, S., Goriely, S., Siess, L., et al. 2019, A&A, 625, L1 [NASA ADS] [CrossRef] [EDP Sciences] [Google Scholar]
- Siess, L., & Arnould, M. 2008, A&A, 489, 395 [NASA ADS] [CrossRef] [EDP Sciences] [Google Scholar]
- Tautvaišienė, G., Viscasillas Vázquez, C., Mikolaitis, Š., et al. 2021, A&A, 649, A126 [NASA ADS] [CrossRef] [EDP Sciences] [Google Scholar]
- Van der Swaelmen, M., Viscasillas Vázquez, C., Cescutti, G., et al. 2023, A&A, 670, A129 [NASA ADS] [CrossRef] [EDP Sciences] [Google Scholar]
- van Hoof, P. A. M., Herwig, F., Kimeswenger, S., et al. 2017, Mem. Soc. Astron. Italiana, 88, 463 [NASA ADS] [Google Scholar]
- Vassiliadis, E., & Wood, P. R. 1993, ApJ, 413, 641 [Google Scholar]
- Woodward, P. R., Herwig, F., & Lin, P.-H. 2015, ApJ, 798, 49 [Google Scholar]
We do not consider stars with low enrichment levels ([X/Fe] < 0.2 dex) as barium stars, given the typical uncertainties affecting the abundance determinations.
All Tables
Sensitivity of the abundances (Δ log ϵX) with variations of the atmospheric parameters (considering the atmospheric parameters of BD −07° 402).
Reduced χ2 computed either (i) on the same seven elements (Y, Zr, Ba, La, Ce, Nd, Sm) as for the signed or RMS distances (where Eu is used as a normalizing element), (ii) based on the previous elements plus Eu, or (iii) based on the ten elements (Sr, Y, Zr, Ba, La, Ce, Pr, Nd, Sm, and Eu) with derived abundances in the present paper.
All Figures
|
Fig. 1 Spectral fitting of the 6437.640 and 6645.135 Å EuII lines for four sample stars. Red lines correspond to spectral syntheses with the abundance for Eu listed in Table A.1. Blue and green lines represent syntheses with abundances deviating by ±0.3 dex from the adopted abundance. The magenta line corresponds to the synthesis with a null abundance for Eu. |
| In the text | |
|
Fig. 2 [La/Fe] as a function of [Eu/Fe], The figure includes CEMP-s stars, CEMP-rs stars, and r-process-enriched stars from Masseron et al. (2010) and Karinkuzhi et al. (2021 a) as well as the Ba stars of Roriz et al. (2021). The dashed green line corresponds to abundance-ratio scaling with a pure solar r-process (Goriely 1999), whereas the continuous blue line corresponds to s-process nucleosynthesis abundance ratio scaling with the predictions from the fifth pulse of a 1.5 M⊙ star at [Fe/H] = −1. |
| In the text | |
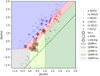 |
Fig. 3 Same as Fig. 2, but with [Ba/Fe] as a function of [Eu/Fe], |
| In the text | |
|
Fig. 4 Histogram of the signed distance (Eq. (1)) of the star samples. Upper panel: star sample of the present study (considering only those with mild and strong enrichments, meaning 11 stars out of 15). Middle panel: Karinkuzhi et al. (2021a) sample of CEMP-rs (red) and -r (green) stars. Lower panel: Karinkuzhi et al. (2021a) sample of CEMP-s stars. The dashed line represents the dS = 0.6 limit between CEMP-s and CEMP-rs stars, as defined in Karinkuzhi et al. (2021a). |
| In the text | |
|
Fig. 5 Comparison of the final elemental surface distributions [X/Fe] (solid lines) obtained after the development of the neutron-capture processes in a 2 M⊙ AGB star of metallicity [Fe/H] = −0.5. The blue line is obtained with diffusive mixing characterized by ƒenv = 0.14 and ƒenv = 0.03, which gives rise to s-process nucleosynthesis, while the red line results from mixing with ƒenv = 0.06 and ƒpulse = 0.06 leading to a PIE, i.e., to a i-process nucleosynthesis. |
| In the text | |
|
Fig. 6 Comparison of the measured abundances with nucleosynthesis predictions from the STAREVOL code. The abundances obtained at the surface of the 2 M⊙ [Fe/H] = −0.5 model with two different sets of the diffusive mixing parameters, (the blue line corresponding to an s-process, and the red line to an i-process) as shown in Fig. 5, are compared with the abundances of the 3 most enriched barium stars (black squares). |
| In the text | |
|
Fig. 7 Comparison of the measured abundance profiles (black squares) with a series of synthetic profiles made by a superposition of s- (as plotted in blue in Fig. 6) and r-process profiles, both varied independently and continuously from a solar-scaled profile with a very low s+r enrichment (purple faded lines) to large s+r enrichments (green faded lines). The synthetic “s+r” profile best matching the measured abundances is plotted as a thick violet line. For both stars, this latter corresponds to a pure s-process contribution (therefore, any r-process contribution would deteriorate the agreement regardless of the s-process contribution). For reference, the i-process profile best matching the measured abundances is plotted in red as in Fig. 6. |
| In the text | |
|
Fig. B.1 Abundance profiles of the program stars color coded according to the adopted classification criteria. The upper panel shows the abundance pattern in stars with no s-process enhancements. The lower panel shows the abundance pattern in three stars with strong s-process enrichments. |
| In the text | |
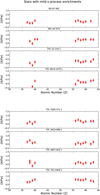 |
Fig. B.2 Same as B.1 but for the eight mildly s-process-enriched stars. |
| In the text | |
Current usage metrics show cumulative count of Article Views (full-text article views including HTML views, PDF and ePub downloads, according to the available data) and Abstracts Views on Vision4Press platform.
Data correspond to usage on the plateform after 2015. The current usage metrics is available 48-96 hours after online publication and is updated daily on week days.
Initial download of the metrics may take a while.