Fig. 4
Download original image
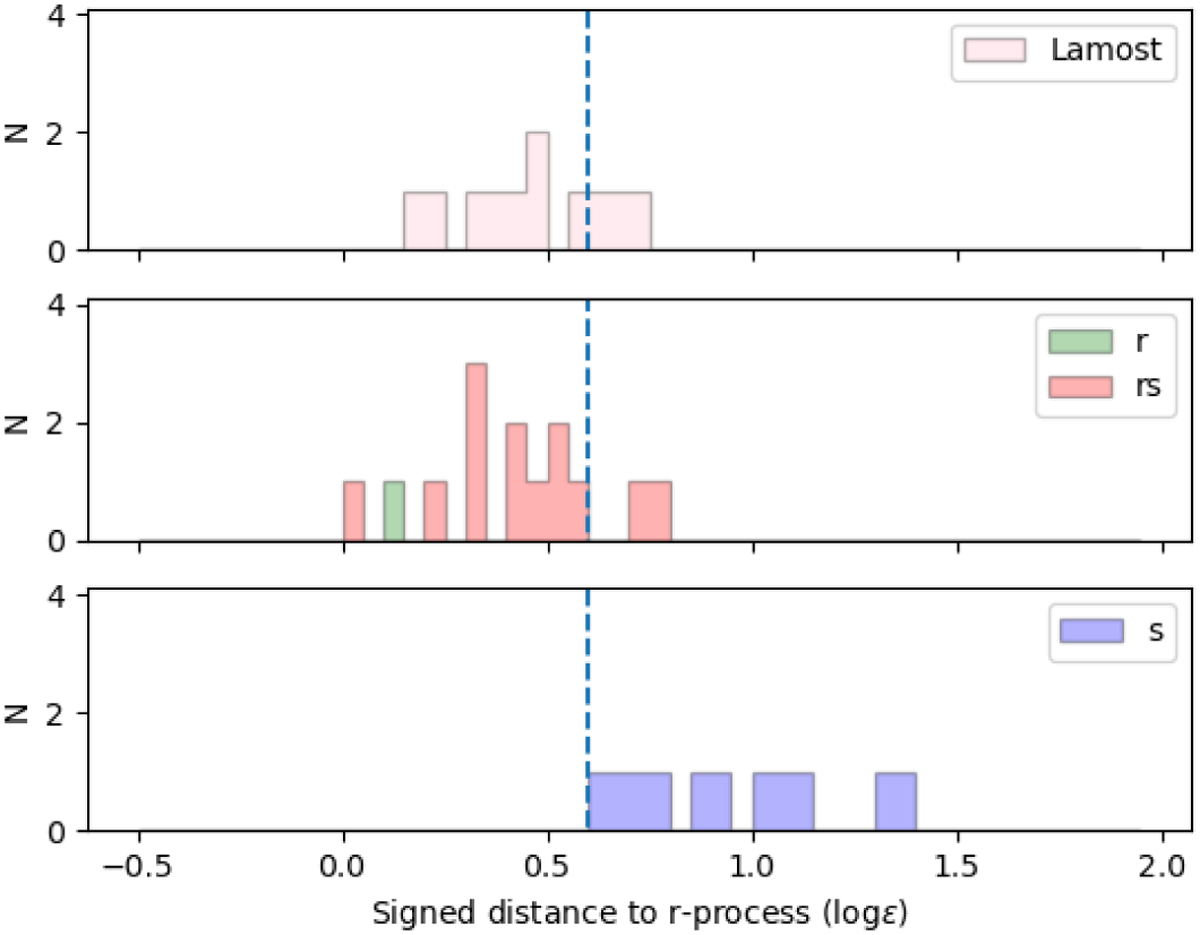
Histogram of the signed distance (Eq. (1)) of the star samples. Upper panel: star sample of the present study (considering only those with mild and strong enrichments, meaning 11 stars out of 15). Middle panel: Karinkuzhi et al. (2021a) sample of CEMP-rs (red) and -r (green) stars. Lower panel: Karinkuzhi et al. (2021a) sample of CEMP-s stars. The dashed line represents the dS = 0.6 limit between CEMP-s and CEMP-rs stars, as defined in Karinkuzhi et al. (2021a).
Current usage metrics show cumulative count of Article Views (full-text article views including HTML views, PDF and ePub downloads, according to the available data) and Abstracts Views on Vision4Press platform.
Data correspond to usage on the plateform after 2015. The current usage metrics is available 48-96 hours after online publication and is updated daily on week days.
Initial download of the metrics may take a while.