Fig. 1
Download original image
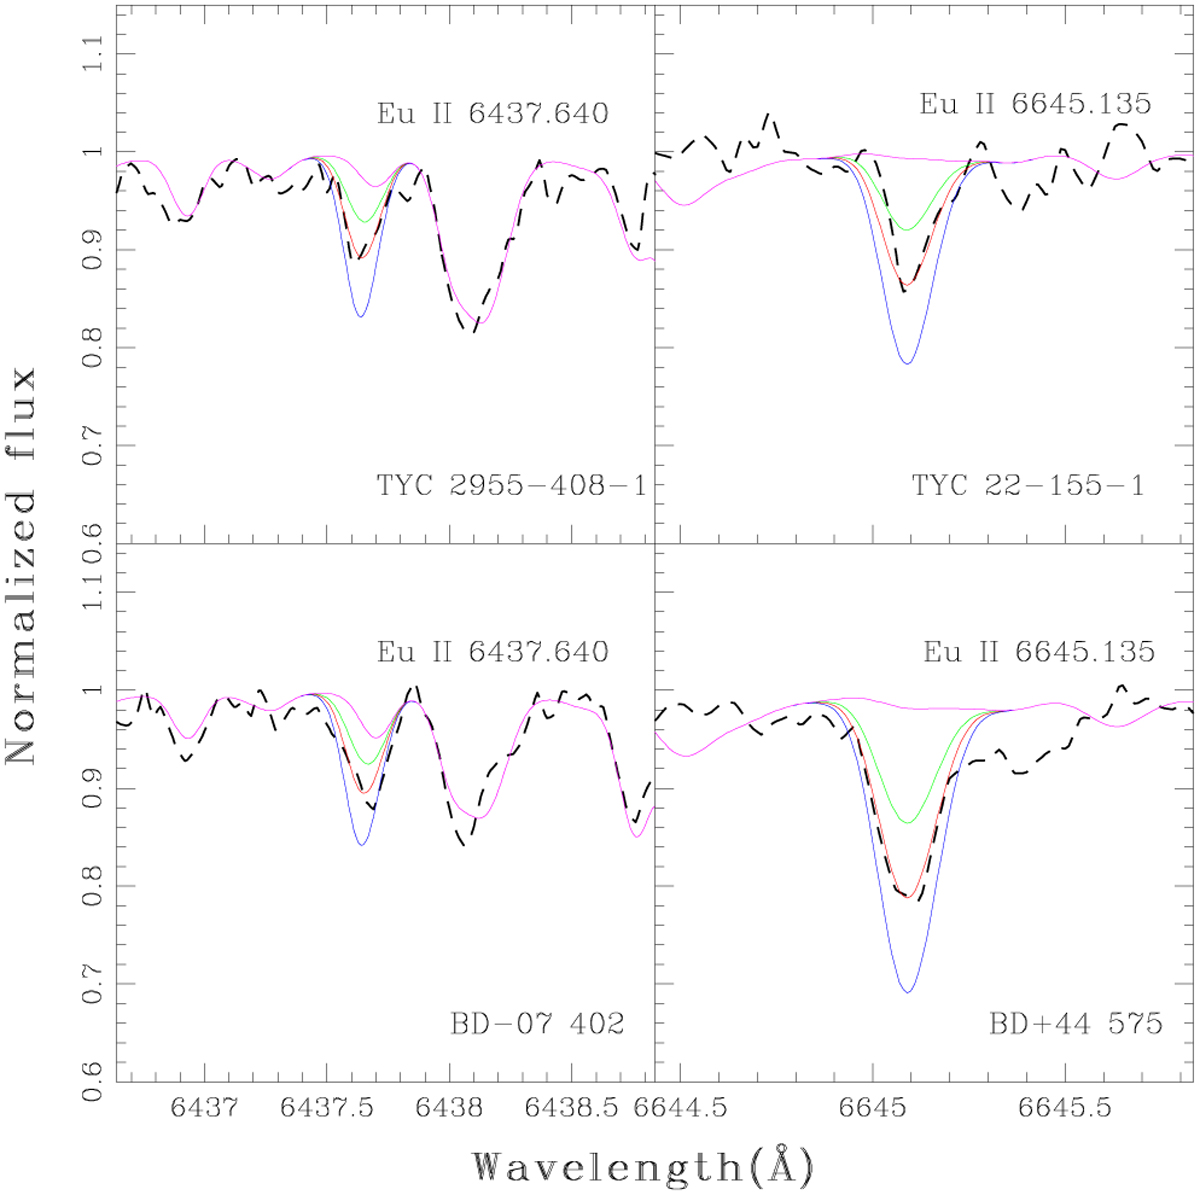
Spectral fitting of the 6437.640 and 6645.135 Å EuII lines for four sample stars. Red lines correspond to spectral syntheses with the abundance for Eu listed in Table A.1. Blue and green lines represent syntheses with abundances deviating by ±0.3 dex from the adopted abundance. The magenta line corresponds to the synthesis with a null abundance for Eu.
Current usage metrics show cumulative count of Article Views (full-text article views including HTML views, PDF and ePub downloads, according to the available data) and Abstracts Views on Vision4Press platform.
Data correspond to usage on the plateform after 2015. The current usage metrics is available 48-96 hours after online publication and is updated daily on week days.
Initial download of the metrics may take a while.