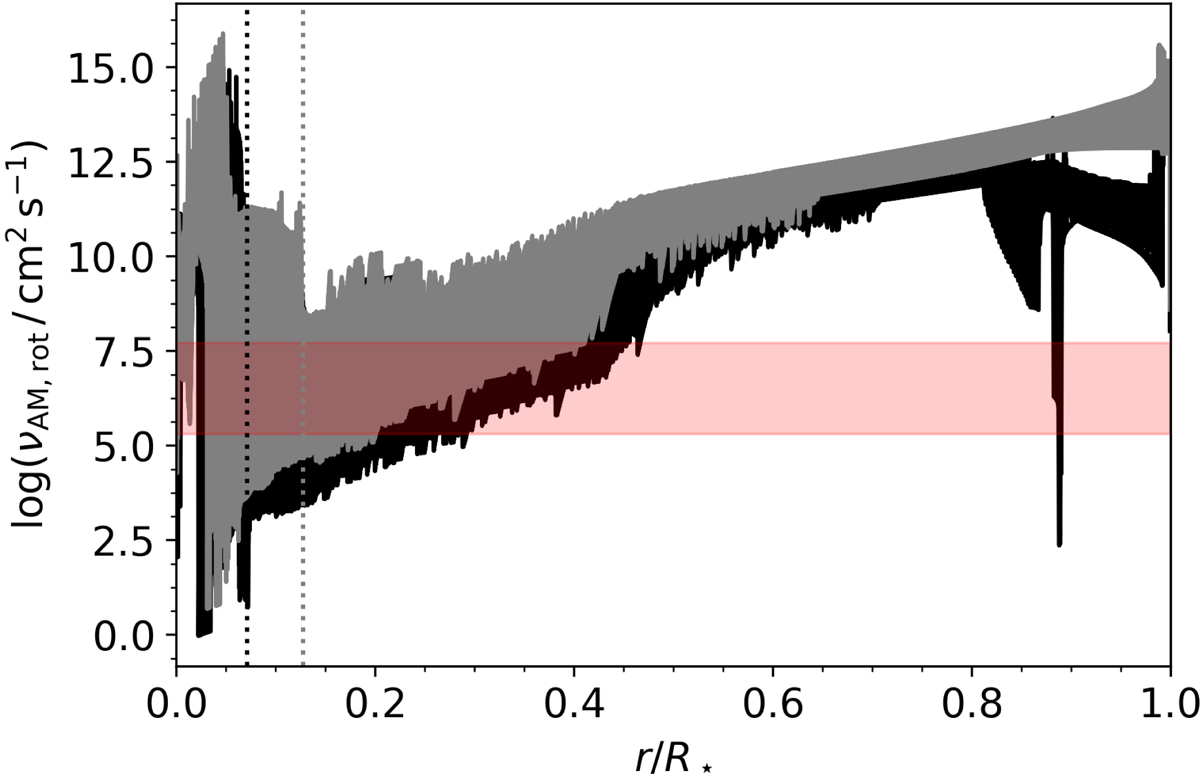
Fig. 6.
Download original image
Range of values of the local viscosity predicted by the rotationally induced processes discussed in Sect. 3 across the MS, for 1.3 M⊙ (in black) and 2 M⊙ (in grey). For both models, (Ω/Ωc)i = 0.1. The red band indicates the range required for a uniform viscosity to match the observations (Sect. 3.1). The maximum extent of the convective core throughout the evolution is indicated by the dotted lines for both masses.
Current usage metrics show cumulative count of Article Views (full-text article views including HTML views, PDF and ePub downloads, according to the available data) and Abstracts Views on Vision4Press platform.
Data correspond to usage on the plateform after 2015. The current usage metrics is available 48-96 hours after online publication and is updated daily on week days.
Initial download of the metrics may take a while.