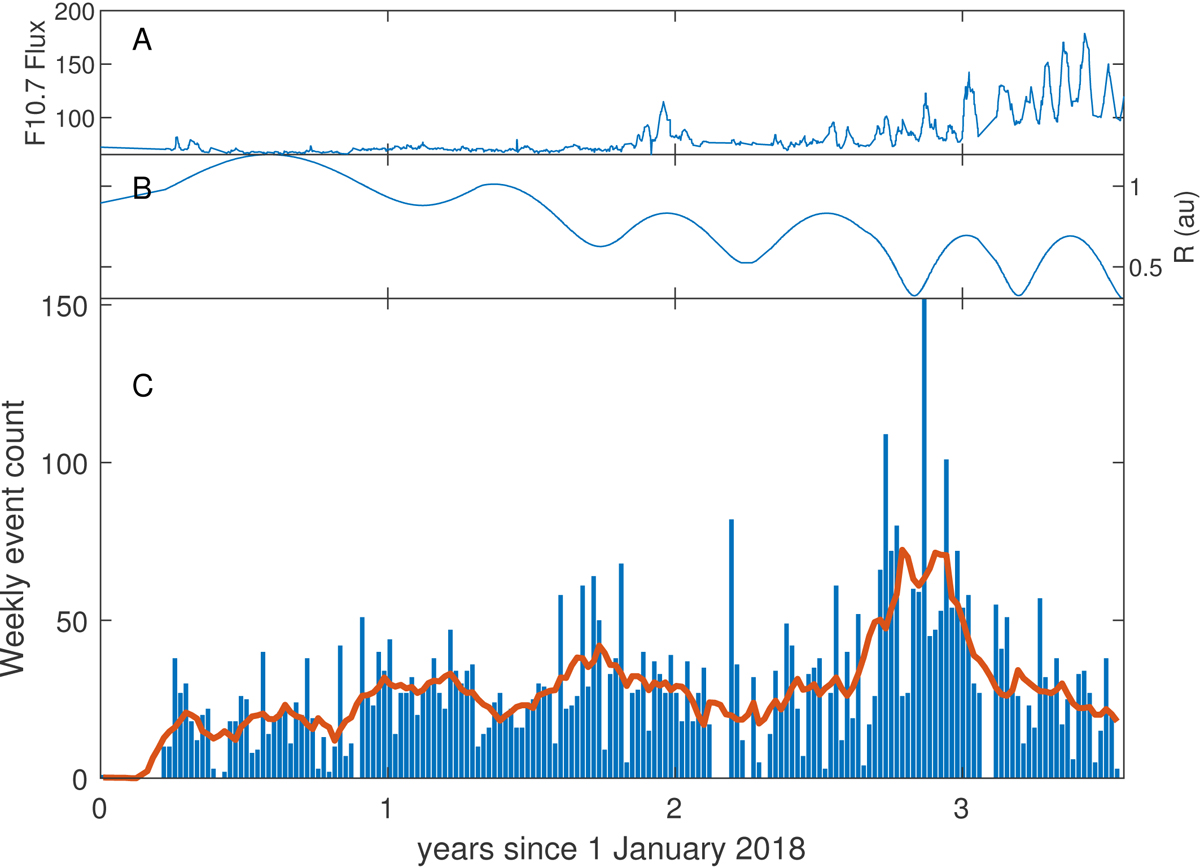
Fig. 2.
Download original image
Number of weekly observed MHs as a function of the cruising time of BepiColombo. Panel A: solar F10.7 flux for each identified MH. Panel B: radial distance of BepiColombo to the Sun for each MH. Panel C: histogram of the number of events observed per week, with the overplotted red line showing a smoothing of the numbers over 4 weeks.
Current usage metrics show cumulative count of Article Views (full-text article views including HTML views, PDF and ePub downloads, according to the available data) and Abstracts Views on Vision4Press platform.
Data correspond to usage on the plateform after 2015. The current usage metrics is available 48-96 hours after online publication and is updated daily on week days.
Initial download of the metrics may take a while.