Fig. 14.
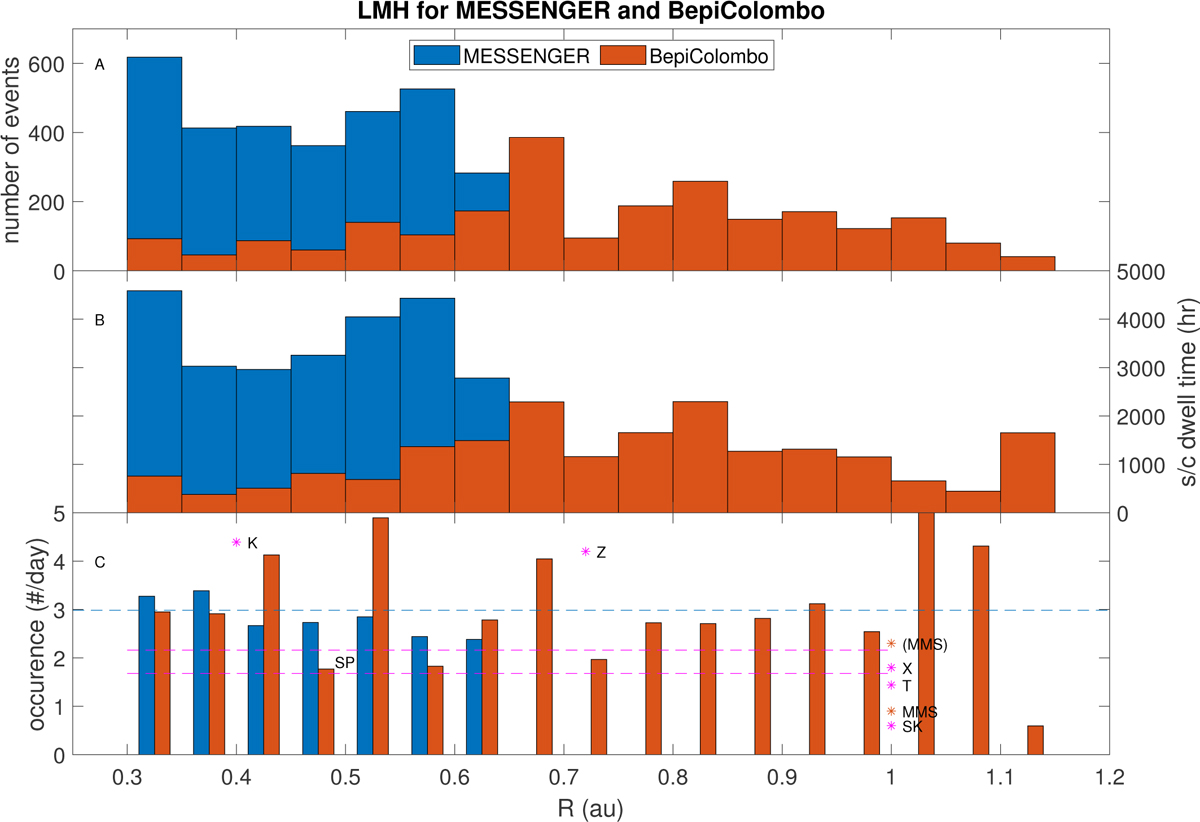
Download original image
Combination of LMHs observed by MESSENGER (blue) and BepiColombo (red). The same format is used as in Fig. 3. The horizontal blue dashed line in panel C shows the average rate for MESSENGER and BepiColombo at 2.98 day−1, and the magenta dashed lines show the range of rates from Sperveslage et al. (2000). The magenta asterisks give other local occurrence rates listed in Table 1.
Current usage metrics show cumulative count of Article Views (full-text article views including HTML views, PDF and ePub downloads, according to the available data) and Abstracts Views on Vision4Press platform.
Data correspond to usage on the plateform after 2015. The current usage metrics is available 48-96 hours after online publication and is updated daily on week days.
Initial download of the metrics may take a while.