| Issue |
A&A
Volume 677, September 2023
|
|
|---|---|---|
| Article Number | A19 | |
| Number of page(s) | 23 | |
| Section | Astrophysical processes | |
| DOI | https://doi.org/10.1051/0004-6361/202245610 | |
| Published online | 24 August 2023 | |
Self-gravitating collapsing star and black hole spin-up in long gamma ray bursts
1
Center for Theoretical Physics, Polish Academy of Sciences, Al. Lotników 32/46, 02-668 Warsaw, Poland
e-mail: This email address is being protected from spambots. You need JavaScript enabled to view it.
2
Department of Physics, School of Science, Ferdowsi University of Mashhad, Mashhad, PO Box 91775 1436, Iran
3
Astronomical Observatory of the Jagiellonian University, Orla 171, 30-244 Kraków, Poland
Received:
2
December
2022
Accepted:
19
May
2023
Abstract
Context. Long gamma ray bursts (GRBs) originate from the collapse of massive, rotating stars. Some of the GRBs exhibit much stronger variability patterns in the prompt GRB emission than the usual stochastic variations. We discuss the mechanisms able to account for this effect.
Aims We aim to model the process of stellar collapse in the scenario of a self-gravitating collapsing star. We account for the changes in Kerr metric induced by the growth of the black hole; accretion of angular momentum; and the self-gravity effect due to a large mass of the collapsing stellar core falling onto black hole in a very short time. We also investigate the existence of accretion shocks in the collapsar, and the role of magnetic field in their propagation.
Methods. We compute the time-dependent axially symmetric general relativistic magnetohydrodynamic model of a collapsing stellar core in the dynamical Kerr metric. We explore the influence of self-gravity in such a star, where the newly formed black hole is increasing the mass and changing its spin. The Kerr metric evolves according to the mass and angular momentum changes during the collapse. We parameterize the rotation inside the star, and account for the presence of large-scale poloidal magnetic field. For the set of the global parameters, such as the initial black hole spin and the initial content of specific angular momentum in the stellar envelope, we determine the evolution of black hole parameters (mass and spin) and quantify the strength of the gravitational instability. We then estimate the variability timescales and amplitudes.
Results. We find that the role of the gravitational instability measured by the value of the Toomre parameter is relatively important in the innermost regions of the collapsing star. The character of accretion rate variability strongly depends on the assumption of self-gravity in the model, and is also affected by the magnetic field. Additional factors are initial spin and rotation of the stellar core. We find that for subcritical rotation of the precollapsed star, a centrifugally supported mini-disc is present at the equatorial plane, and it may be subject to fragmentation due to self-gravitating instability. We also find that self-gravity may play a role in the angular momentum transport and that it generally lowers the final mass and spin of the black hole, while the accretion-rate variability amplitude is much larger in self-gravitating objects. The effect of magnetic field is rather weak, while it seems to decrease the strength of accretion shocks. The magnetisation affects the global properties of the flow in a non-linear way, and is manifested mostly in models with moderate initial black hole spins but supercritical rotation of the collapsing star.
Conclusions. Our computations confirm that gravitational instability can account for flaring activity in GRBs and the variations in their prompt emission. Rapid variability detected in the brightest GRBs (most likely powered by rapidly spinning black holes) is consistent with the self-gravitating collapsar model, where the transonic shocks are formed. The effect should be weakened by magnetic field.
Key words: accretion / accretion disks / black hole physics / gravitation / magnetohydrodynamics (MHD) / stars: massive / gamma-ray burst: general
© The Authors 2023
 Open Access article, published by EDP Sciences, under the terms of the Creative Commons Attribution License (https://creativecommons.org/licenses/by/4.0), which permits unrestricted use, distribution, and reproduction in any medium, provided the original work is properly cited.
This article is published in open access under the Subscribe to Open model. This email address is being protected from spambots. You need JavaScript enabled to view it. to support open access publication.
1. Introduction
Massive stars are born, live, and die collapsing under their gravitational force, and eject their outer hydrogen-rich envelopes after billions of years of transforming light elements into heavier ones via nuclear fusion. In the last stage of their evolution, they are called collapsars if the star rotation velocity is large enough to enable formation of an accretion disc in the core. In contrast to the low-mass stars, which leave white dwarfs as their compact remnants, the more massive ones with masses ≳8 M⊙ die violently in supernova explosions that eject freshly synthesized elements, enriching the interstellar medium. In this case, the iron core of the progenitor collapses to a neutron star or black hole. These types of explosions are called core-collapse supernovae (CCSNe) and the particular type of remnant after the final stage of evolution of the massive star depends on its mass, metallicity, and rotation rate (Janka et al. 2007; Woosley & Heger 2015). More precisely, in the simplest case of no rotation and no mass loss, for stars of masses of 8 − 30 M⊙, their iron core collapses to a neutron star, leading to supernova. However, some of these stars may either not explode or explode incompletely, leaving a black hole as a remnant. This occurs especially for stars with massive helium cores from 7 M⊙ to 10 M⊙. In cases of stars with a mass of 30 − 80 M⊙ (helium core mass 10 − 35 M⊙), formation of a black hole is relatively likely. Rotation generally shifts the main sequence mass ranges (but not the helium core masses) downwards for each outcome. Mass loss complicates the relation between initial main sequence mass and final helium core mass (Woosley & Heger 2015).
Gamma-ray bursts (GRBs) may accompany some of the type I b/c supernovae explosions. These transient events are characterised by a sudden release of about 1051 − 1054 ergs of energy in a volume with a radius of less than 100 km and with a duration of 0.01 to 100 s (for reviews, see e.g. Piran 2004; Kumar & Zhang 2015). According to the duration time T90, which is defined as the time interval over which 90% of the total background-subtracted counts are observed, GRBs are usually separated into two classes: long GRBs (LGRBs; T90 > 2 s), whose existence emanates from the core collapse of massive stars (Woosley 1993; Hjorth et al. 2003), and short GRBs (SGRBs; T90 < 2 s), whose origins are thought to be the coalescence of neutron stars (NSs) or NS–black hole binary systems (Eichler & Cheng 1989; Narayan et al. 1992). Most observed GRBs (70%) have a duration of greater than two seconds and are classified as LGRBs. As these events constitute the majority of the population and tend to have the brightest afterglows, they have been observed in much greater detail than their short counterparts. Almost every well-studied long GRB has been linked to a galaxy with rapid star formation, and in many cases to a CCSN as well (Woosley & Bloom 2006). Long GRB afterglow observations, which reflect their association with high redshift (z ≳ 5), are also consistent with the GRB having originated in star forming regions (Pontzen et al. 2010). However, not all the collapsing stellar cores give birth to GRBs. Only those with sufficiently large angular momentum for the progenitor to have an accretion disc at the equatorial plane are capable of producing LGRBs (see e.g. Janiuk & Proga 2008; Janiuk et al. 2008, and Król & Janiuk 2021). If this condition is not satisfied, the collapse will proceed without an electromagnetic transient and the star will not be visible in the field of view of our telescopes (Murguia-Berthier et al. 2020). Otherwise, the creation of a jet via the process of accretion is a key factor accounting for the formation of a GRB. The strong magnetic field that can be sustained during the process of collapse, and is amplified by the differential rotation and dynamo effects, helps to launch relativistic jets from the accretion disc. These jets further break through the stellar surface and at large distances produce emission in gamma rays (Zhang et al. 2003).
In previous work, we built a numerical model that accounts for a dynamical change of black hole parameters and the related Kerr metric during the collapse onto a newly formed black hole. We used general relativistic hydrodynamical (Janiuk et al. 2018) or magnetohydrodynamical (MHD) simulations (Król & Janiuk 2021) to probe the amount of angular momentum in the collapsing star envelope and the conditions sufficient to produce either a GRB or just a massive, moderately rotating black hole with no electromagnetic transient. In both these works we evolved the Kerr metric of the space-time surrounding the rotating black hole with changing mass and spin. However, we neglected the gravitational force of the massive star itself, which acts on the collapsing gas. This simplification was justified by the fact that the massive core is very compact in comparison with the diluted stellar envelope residing in a much larger volume. In the present work, we release this simplifying assumption and extend our model with a new numerical scheme where we account for the self-gravity of the star. We do so via a perturbative approach, and therefore still do not solve the full set of Einstein equations. This is done by integration of mass and angular momentum in the flow around the centre at any given radius, and by adding this component as a small term to the mass and spin of the black hole, which are constituents of the Kerr metric defined locally. In this way, we more accurately represent the influence of self-gravitating mass enclosed in the volume on the orbiting material. We analyse the possible instabilities in the self-gravitating collapsing stellar core, and we also find regions where shock discontinuities are formed. We also study the process of stellar collapse by allowing the initial core radius to vary slightly and we therefore define different initial conditions for the subsequent formation of a rotationally supported accretion disc. Finally, we account for the magnetic field component that perturbs the accretion rate and we estimate the timescale of variability, which may be reflected in the observed properties of GRBs, that is, when the jets are formed.
Similarly to our previous studies, we explore the properties of an exemplary model, assuming the 25 M⊙ envelope of a collapsing star and a 3 M⊙ initial black hole mass formed from the core. We probe the parameter space in a similar way to in our previous study; that is, we vary the value of the initial black hole spin, the magnitude of angular momentum inside the envelope, and the strength of the magnetic fields. However, we extend this parameter space to larger specific angular momentum endowed upon the star, and we implement several alternative magnetic field configurations. We compare the results of new models –that is, those with self-gravity of the collapsing core– to those without self-gravity force.
The article is organised as follows. In Sect. 2, we present the general framework of our model, which was developed upon the general relativistic MHD code and was extended to work with the time-dependent Kerr spacetime metric in previous papers. In Sect. 3, we describe our advancement of the previous model, which is the implementation of self-gravity of the collapsing star in the spacetime dynamics. In Sect. 3.2, we describe a modification to the inner boundary condition, in Sect. 3.3, we describe the perturbative method used to compute the change of mass and angular momentum of the black hole due to self-gravity, and in Sect. 3.4, we define the magnetic field configurations used in our testing models. In Sect. 4, we present the results of our calculations. In particular, in Sect. 4.1, we describe the time evolution of the self-gravitating, non-magnetised stellar cores, and compare them to our previous, non-self-gravitating models. In Sect. 4.3, we present a detailed analysis of the gravitational instability, which is a new feature found in the newly developed models, and Sect. 4.4, we present the evolution of magnetised, self-gravitating collapsing cores. In Sect. 5, we discuss our results in the context of GRB phenomenology, and in Sect. 6, we summarise our conclusions.
2. Time evolution with accreting black hole mass and spin update
Apart from the modifications described in Sects. 3.2 and 3.3, we follow the time evolution of the collapsing core as described in Król & Janiuk (2021). We use the general relativistic MHD code called high-accuracy relativistic magnetohydrodynamics (HARM), originally established by Gammie et al. (2003; see also Noble et al. 2006). The code introduces a conservative, shock-capturing scheme with low numerical viscosity to solve the hyperbolic system of partial differential equations of GR MHD. The numerical scheme uses the plasma energy-momentum tensor, Tμν, with contributions from matter (gas) and electromagnetic field. For the GR MHD evolution, we solve two fundamental equations: the equation of mass and energy-momentum conservation, which are as follows:
 (1)
(1)
The energy stress tensor is a sum of two parts, gas and electromagnetic:
 (2)
(2)
 (3)
(3)
 (4)
(4)
where uμ denotes the four-velocity of gas, u represents internal energy density, and bμ and h are magnetic four-vector and the fluid specific enthalpy, respectively. The MHD scheme is brought in conservative form by implementing a Harten-Lax-van Leer (HLL) solver (Harten et al. 1983) to calculate the corresponding fluxes numerically.
The fluid equation of state is that of a polytrope with a pressure P = Kργ, where ρ is the density, γ = 4/3 is the adiabatic index, and K is the specific entropy, in this case taken to be that of a relativistic fluid with inefficient cooling.
We have developed a new version of the HARM code, which has already been implemented by Janiuk et al. (2018). This new version considers a dynamically evolving space-time with changes in the parameters of the central black hole. The simulations start after the black hole has already formed and its gravitational field is assumed to control the subsequent space-time evolution. The matter is then allowed to accrete onto it, and the code applies a sequence of quasi-stationary solutions with the mass and spin of the black hole updated by a very small value at each time step. The line element (metric) of the Kerr black hole in the Boyer–Linquidst coordinates is given by:
 (5)
(5)
where Δ = r2 − 2MBHr + a2, Σ = r2 + a2cos2θ, and  , with MBH and J being the mass and angular momentum of the black hole, respectively. To put the evolution of the parameters of the black hole into effect, one can consider the metric to be changed discretely between the consecutive time steps according to small changes in mass and spin, that is,
  , and
, and  , where
  reflects the current black hole mass at time t > 0,
  denotes the initial mass of the black hole at t = 0, and
  and Ė are the flux of angular momentum and energy flux transmitted through the event horizon. The six non-trivial Kerr metric components are then updated at every time step to get their new values.
Our grid size is that of Rout = 1000rg, and the resolution is 256 × 256 points in the radial and polar directions. The outer boundary conditions in the radial direction are free outflow (variables are copied to the two ghost zones). In the polar direction, reflecting boundary conditions are assumed (velocity and magnetic field components change their signs on the polar axis).
3. Self-gravitating collapsar model
Now, we calculate the time evolution of the collapsing massive star using the GR MHD scheme, using the new version upgraded from that presented in Janiuk et al. (2018). The evolution of the space-time Kerr metric is again accounted for by the increasing mass and changing spin of the black hole in the collapsing stellar core. However, new terms due to the self-gravity of the star are computed and volume-integrated at every time-step during dynamical simulation.
3.1. Initial conditions
We adopt the initial conditions similar to those used in Król & Janiuk (2021), namely a slowly rotating, transonic, quasi-spherical accretion flow with small angular momentum. The initial distribution of density and radial velocity in the accreting sphere is given by a numerically integrated Bondi solution, which we parameterize with the location of the sonic radius; in our models, it is fixed at rs = 80rg. Below this radius, the matter falls into the black hole supersonically, reaching the speed of light at the event horizon.
Once the critical point is determined, the velocity at this critical point is (Shapiro & Teukolsky 1986)
 (6)
(6)
where r is the radial coordinate and ur is the radial component of the four-velocity. The radial velocity can be obtained by numerically solving the relativistic Bernoulli equation:
 (7)
(7)
and the density is set by the mass-accretion rate Ṁ:
 (8)
(8)
The specific entropy value, K, depends on the radial velocity and is taken to be (Suková & Janiuk 2015; Suková et al. 2017; Palit et al. 2019)
 (9)
(9)
where  is the local sound speed.
The small angular momentum is imposed on the spherically distributed gas, similarly to Król & Janiuk (2021). The specific angular momentum is normalised with the parameter S, such that the flow is circularised at the innermost stable circular orbit (ISCO). In addition, the rotation velocity scales with the polar angle, so that at the equator, namely at θ = π/2, the rotation of the star is maximal.
 (10)
(10)
with
 (11)
(11)
Here the radius rISCO in Kerr geometry depends on the spin of the black hole. Our black hole spin parameter is set in the initial setup, and is denoted as A0 hereafter. We use both subcritical and supercritical rotation speeds, parameterized with S < 1 and S > 1, respectively. Our model parameter space is therefore defined by S and A0.
We note here that in this formulation, the black hole in the centre of the collapsing stellar core is already as massive as MBH = 3 M⊙, which scales the length unit of rg = 4.45 × 105 cm. This means that our computational grid size in cgs units is only 4.45 × 108 cm. Therefore, if a compact C–O core of a Wolf-Rayet star or a presupernova of 25 M⊙ (Woosley & Heger 2006) is assumed as our initial model, it is now squeezed into a much smaller volume and reaches order-of-magnitude larger densities in the centre. Our model is compact enough to address the problem of self-gravitating gas close to the horizon of a newly formed black hole. We do not address any prior or ongoing supernova explosion here. Depending on the rotation parameter, S, the ultimate outcome might be either a direct collapse or the formation of a mini-disc inside the stellar core, that is, a collapsar (as depicted in Fig. 1). The latter may lead to an electromagnetic transient.
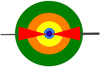 |
Fig. 1. Schematic view of the collapsar at the onset of the GRB: stellar core (dark blue), stellar envelope composed of subsequent accreting shells with decreasing density (light blue-yellow-orange-green), and rotationally supported accretion disc formed at the equatorial region (red). The horizontal black line represents the equatorial plane. The circle marked with a stripped line represents an exemplary chosen radius above the horizon, at which the gas feels the perturbative force due to the self-gravity of the matter enclosed within this radius (see Eq. (7)). |
3.2. Boundary condition between the initial stellar core and outer flow
For numerical reasons, we need to ensure that a sufficient number of grid cells are located below the event horizon. The inflow of matter then proceeds smoothly through the horizon thanks to the change of coordinates to the Kerr-Schild ones, which are non-singular. In the initial setup, we assume that the transition between the newly formed black hole and the accreting stellar core is shifted by a certain factor. We choose a shift radius on the order of 1.2 rg in order to account for the smooth free-fall of the stellar shells onto the black hole, which has already been shielded by the event horizon. Therefore, we introduce an initial offset between the radius of the event horizon – in rg units– and the dense surrounding gas. The inner radius of the accreting stellar core is now placed at Rin = Rshift ⋅ rh. Our model parameter Rshift, therefore represents the initial inner radius of the stellar core before the collapse starts. Its minimum value, 1.0, would imply that the collapse starts immediately when the black hole has formed. Otherwise, values larger than 1 imply a slight delay of the growth of the black hole. The shift provides numerical stability to the initial phase of the simulation.
3.3. Modification of the stellar core structure due to the self-gravity
We chose the Teukolsky equation to describe the self-force acting in the collapsing gas. This equation describes gravitational, electromagnetic, and scalar field perturbations of a rotating Kerr black hole (Teukolsky 1972). The global vacuum solution of the Teukolsky equation is given by the CCK method (see Chrzanowski 1975; Cohen & Kegeles 1974; Wald 1978), which reconstructs the metric perturbation and shows that only perturbations of the mass and angular momentum (δM and δJ, defined below) are to be concluded within the Kerr metric. We notice that in the weak field limit, the Einstein gravitational field equation will be reduced to the Poisson equation leaving us with the only non-zero component of the perturbed metric potential (cf. Ryu et al. 2020).
Recently, van de Meent (2017) showed that the perturbation due to a particle on a bound orbit around a black hole described by the CCK metric affects the Kerr parameters describing the mass and angular momentum of the black hole for the metric ‘outside’ the particle’s orbit and vanishes ‘inside’ the orbit. Our work proposes a numerical implementation of this method, and follows the assumptions of van de Meent (2017) for fluid dynamics instead of particles; we therefore compute volume integrals of the corresponding stress–energy tensor components. By definition, the problem does not assume spherical symmetry. The potential wells may therefore appear off-axis in the whole region ‘outside’ the orbit of a given fluid element.
We have developed a new version of the GRMHD numerical code HARM. As the initial results show (Janiuk 2022a), we expect to see more mass and spin growth of the black hole after incorporating the perturbation effects of the accreting disc into the updating metric.
In our new simulations, both the mass and angular momentum accreted onto the event horizon –and used to update the Kerr metric coefficients– are now modified by the perturbation acting on the metric in the region above the horizon due to the self-gravity force that the gas feels at a given distance from the horizon (a schematic view of the calculation is depicted in Fig. 1). These perturbative terms are calculated from the stress–energy tensor. Therefore, in addition to the two equations governing the growth of black hole mass and spin via the mass and angular momentum transfer through the horizon:
 (12)
(12)
and
 (13)
(13)
(see Janiuk et al. 2018 for more details),
we now calculate
 (14)
(14)
which is computed at every radius above the event horizon. Analogously, the angular momentum of the black hole will change by adding the perturbation
 (15)
(15)
The dimensionless spin of the black hole, as a result, will change by
 (16)
(16)
where ai = ai − 1 + Δa, according to Eq. (7) in Janiuk et al. (2018).
Having different δM and δJ at each grid point in the radial direction at each time affects the metric coefficients, which are sensitive to the mass and spin update. Our main development of the Janiuk et al. (2018) model is that we add a new module in the time-dependent code that accounts for the self-gravity force. In the rest of the paper, we present the results computed with this module enabled in the simulation setup. We also compare these results with the runs without self-gravity (with the new modules switched off) in order to emphasise the difference and to investigate the role of self-gravity in the collapsar physics.
3.4. Post-collapse magnetic field and its chosen structure
We assume that the evolution of the collapsing stellar core prior to the simulated phase was unaffected by the particular configuration of the magnetic field. This is justified, as we address the class of massive stars with relatively weak fields. The surface magnetic fields can be constrained by observations, and these suggest that there might be a bimodal distribution (Petit et al. 2019). The magnetic fields in the stellar core are unknown and all scenarios are uncertain. Currently, various presupernova models and scenarios adopt only general scaling of magnetic fields, such as a large-scale dipole (Reichert et al. 2023). Some models use the fields inherited from the stellar evolution models (Woosley & Heger 2006), possibly supplemented by a toroidal component and amplified via a dynamo mechanism in a differentially rotating star (Spruit 2002), which may lead to the ultimate formation of a protomagnetar in the core (Obergaulinger et al. 2009).
In our simulations, we consider some possible effective modification of the collapsing zone due to the action of the weak magnetic field, which is dynamically unimportant. Our application of the realistic evolved star field geometry to our quasi-spherical mass distribution is not unique, and we introduce two specific prescriptions: (i) uniform magnetic field and (ii) dipole magnetic field.
Therefore, we introduce the magnetic field in our initial conditions by defining the shape of the magnetic vector potential, and setting up a proper normalisation. First, we assume that the initial accreting gas is embedded in a simple poloidal configuration of the magnetic field, as discussed already in Król & Janiuk (2021). In this case, the only non-vanishing component of the magnetic field vector potential is given by:
 (17)
(17)
Furthermore, as a variation of the uniform field derived for the Kerr black hole, we adopt the formula by Wald (1974):
![Mathematical equation: $$ \begin{aligned} A_{\varphi } \propto \left[ {1 \over 2} (r^{2}+a^{2}) - a^{2} r \Sigma ^{-1} (1 + \cos ^{2}(\theta ) \right] \sin ^{2}(\theta ). \end{aligned} $$](/articles/aa/full_html/2023/09/aa45610-22/aa45610-22-eq26.gif) (18)
(18)
We normalise this uniform field, assuming an initial maximum gas-to-magnetic pressure ratio, β = (γ − 1)u/(0.5b2).
The second scenario assumes a dipole field, where vector potential is given by
 (19)
(19)
We normalise the magnetic field to a chosen initial value of maximum gas-to-magnetic pressure ratio, β0 = pgas/pmag, which in the case of the Bondi gas distribution is reached at the event horizon. By implementing these various field strengths and setups, we aim to verify the astrophysical implications of the magnetic field configuration for the collapsar scenario as the central engine for LGRBs.
In summary, in comparison with previous code applications (Janiuk et al. 2018; Król & Janiuk 2021), we incorporate three major modifications:
-
the offset of the initial stellar core,
-
the metric evolution to account for self-gravity effects,
-
several different setups and strengths of magnetic fields, designed to model realistic stellar cores.
4. Results
The HARM code works in dimensionless units of G = c = 1. Conversion coefficients can be found in Table 1.
Geometric units to cgs units conversion.
We calculated several sets of models, which differ with respect to the chosen initial parameters, and with respect to the presence or absence of self-gravity effects and magnetic fields. All models and their input parameters are listed in Table A.1, where we give the values of the initial black hole spin A0 in dimensionless units, the inner radius of the collapsing stellar core, Rshift (equal to the stellar core radius, or no pre-collapsed core, in which case the inner radius is located at the ISCO), and the initial specific angular momentum, S, in the accreting gas. The self-gravity effect is denoted as either ‘yes’ or ‘–’ in the Table. For magnetised models, we provide the type of field initial configuration (vertical or dipole) and give the initial strength of the field, normalised either to the ratio of gas to magnetic pressure at β0, or to the initial magnetisation, σ0.
Below, we show the results for the time evolution of the disc under the self-force, and we compare them with previously observed trends, that is, in calculations where the self-gravity was neglected. We consider for now only the non-magnetised models. In the following subsection, we present a few characteristic properties of the low-angular-momentum, quasi-spherical accretion models, analysed with respect to their gravitational stability. The magnetised models will be presented in more detail in Sect. 4.4.
4.1. Time-dependent evolution
From the point of view of the evolutionary timescales, the black hole mass is a key parameter as it determines the scale size of the object. Here, we concentrate on the results for the initial black hole mass of MBH = 3 M⊙ and we check whether the whole star collapsed to the black hole, contributing to its final mass.
We check how the evolution proceeds for various initial spin parameters, and several values of the rotation parameter. We compare the time profile and the time-averaged value of the accretion rate during the collapse for self-gravitating (SG) and non-SG models. We also check the evolution of black hole spin, and identify the maximum spin value reached during the collapse. We then compare the final black hole spin value, which saturates when the collapse is ended. These results are given in the Table A.1.
Assigning three different values to the initial rotation parameter, S = 1, 1.4, and 2, and two values of 0.5 and 0.85 to the initial black hole spin parameter A0, we analyse the evolution of our model features, that is, accretion rate, and the black hole mass and dimensionless spin parameter. The time profiles of these quantities are plotted in Fig. 2. Both cases including and excluding self-gravity are compared. The three panels show the black hole mass profile (left), the accretion rate (middle), and black hole spin evolution. (In the rest of the paper, we label the models with their acronyms, corresponding to those used in Table A.1.)
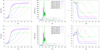 |
Fig. 2. Evolution of the accretion rate and black hole parameters including and excluding self-gravity plotted by the thick and thin curves, respectively. The top panels refer to the initial black hole spin parameter A0 = 0.85 while the bottom panels correspond to A0 = 0.5. Three different values for the initial rotation parameter are also considered, i.e. S = 1, 1.4, and 2, shown with the blue, pink, and green curves. The left plots refer to the evolution of black hole mass, the middle plot shows the accretion rate temporal behavior, and the panels to the right demonstrate the evolution of the black hole spin parameter. Models are labelled in the middle panels with symbols referring to Table A.1. |
Giving different initial black hole spins, we find no remarkable changes in the MBH evolution. However, the situation differs when it comes to various rotation parameters S. We notice that the larger the initial rotation magnitude, the longer it takes for the black hole mass to evolve. The non-SG simulations end with very different final black hole mass, depending on the S parameter. This is because material retained by supercritical rotation is affected by the centrifugal force and remains in the accretion torus, while only the material from polar regions is able to reach the black hole quickly, that is, within the free-fall timescale, as was found by Janiuk et al. (2018). In contrast, the self-gravity of the envelope can speed up the evolution of the collapsing stellar core significantly. We also observe no significant difference in the black hole mass evolution between the two cases where S ≥ 1. Only in the S = 2 run is the final black hole mass significantly smaller than the total mass of the evolved stellar core, and it saturates at a value of about 20 M⊙ (see Table A.1 for details).
The middle plots of Fig. 2 confirm that, when self-gravity effects are not taken into account, there are longer time intervals where there is considerably less fluctuation of the accretion rate; in this case, there exist some oscillations in the accretion rate during some time intervals (around 0.2 s for S = 1.4, and 0.4 − 0.5 s for S = 2). Before these periods of time, there seems to be some mass accumulation in the inner regions, as observed in the density profiles and also in specific angular momentum distributions in different time snapshots (see following subsection). This mass accumulation followed by fluctuations in the accretion rate is attributed to the generation of the rotationally supported torus in the inner stellar core, which is concentrated on the equatorial plane. On the other hand, in curves with self-gravity, the mass-accretion rate increases and drops much more sharply than in non-SG models, presenting a characteristic pattern of a sudden fluctuating rise in very short periods of time (less than 0.1 s). We notice here that those sharp peaks have very large magnitude, but their height may be to some extent affected by numerical resolution, and overestimated. The mass accumulation prior to the oscillations can be seen in this case as well. We find a fluctuating reduction in the size of the rotationally supported torus, followed by the formation of an inhomogeneous structure in density profiles that may account for this temporal behavior. We present further details of these events in the following section.
Considering the black hole spin (dimensionless, and so the angular momentum of the black hole increases with decreasing mass), we find that in self-gravitating models, a notable increase in black hole mass corresponds to the spin parameter reaching its maximum. Further accretion after this time brings more matter than angular momentum to the central object, resulting in a considerable rise in MBH and a subsequent drop in spin. This drop coincides with a remarkable increase in accretion rate onto the black hole. The non-SG models behave differently. Here, the black hole mass and spin rise more slowly than in SG models. However, a maximal spin is reached earlier than maximum mass (for subcritical rotation, S = 1), or is reached at a rather late time, when the black hole mass has still not saturated on the final value (for S = 2).
We also find that black hole spin reaches its maximum value when the rotationally supported region close to the black hole is shrinking. The self-gravity effect seems to speed up this evolution. Moreover, a higher value of the rotation parameter S, as well as the presence of a disc at late times in the collapsar with S = 2, leads to a less massive but more rapidly spinning black hole, as can be found in the green curves in the right panel of Fig. 2. The final spin in this case is about A = 0.4 − 0.5.
Figure 3 shows the evolution of the black hole spin, where we compare the runs with various initial spin A0. The thick lines represent self-gravitating stars, while the thin lines are shown for comparison, and represent calculations where self-gravity is neglected. The initial black hole spin is taken in the range of A0 = 0.3 − 0.85. In the two panels, we show the simulations with critical and supercritical angular momentum content inside the collapsing star, namely S = 1 and S = 2. As the figure shows, the models with S = 1 tend to have a smaller value of maximum and final black hole spin. The maximum value during the collapse is reached at about t ∼ 0.1 s (around time 5000 tg in geometric units) and correlates with the initial spin value. The net spin-up is greatest for smallest A0 = 0.3, while for A0 = 0.85 the black hole does not increase its spin, and only a temporary flattening of the spin time-evolution profile is observed. Similarly to the cases presented in Fig. 2, we notice that the evolution of the spin proceeds much faster in the self-gravitating star. Nevertheless, the final black hole spin is almost the same for all models (about 0.2). For super-critical rotation of the star, on the other hand, the value of maximum spin is almost the same for all models, regardless of the initial spin value, and is about Amax = 0.87 (see Table A.1). In contrast, the final spin value is systematically higher than for the case of S = 1, and it somewhat depends on the initial black hole spin. The greatest net spin-down of the black hole during the whole simulation is seen for A0 = 0.85. The values of maximum and final spins for all models are reported in Table A.1.
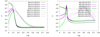 |
Fig. 3. Time evolution of the black hole spin for the rotation normalised with specific angular momentum at ISCO S = 1.0 (left) and S = 2.0 (right). Thick lines represent self-gravitating models and thin lines show the case where self-gravity is neglected. Various initial black hole spin values are shown, as labelled in the plots and marked by dark green for a0 = 0.85, violet for a0 = 0.6, magenta for a0 = 0.5, and light green for a0 = 0.83. Models are labelled in both panels with symbols referring to Table A.1. |
We notice that all our models evolve very quickly as a consequence of the small radius of the computational domain. Our collapsing stellar core is squeezed into a volume that is much reduced with respect to a typical stellar progenitor. A star with a radius of about 1012 − 1014 cm would take hours to entirely collapse. On the other hand, for a long gamma ray burst, it is sufficient to sustain the accretion disc in the collapsar for about 100 seconds. As was demonstrated with a toy model by Janiuk et al. (2008), the GRB event is expected to last between 20 and 40 s or around 100–150 s for a collapsing star where the black hole is being fed with mass and angular momentum, while the rotationally supported accretion disc is sustained (cf. Fig. 9 in their paper). The most violent changes of the black hole parameters occur at the very initial phase, which corresponds to the shells collapsing from radii below 109 − 1010 cm, where most of the mass is enclosed. Our calculations, now beyond this old toy model and employing full GR hydrodynamics, confirm this qualitative picture.
4.2. Effects of the self-force on the flow properties
In this section, we present further details of the properties of the self-gravitating collapsing star for chosen models. We analyse specific time snapshots, which correspond to the characteristic features found in the time profiles, namely mass-accretion rate and black hole spin.
4.2.1. Density inhomogeneities and formation of the accretion shocks
In Fig. 2, we show time profiles of the accretion rate through the event horizon, which exhibit a sudden increase at early times of the simulation followed by an oscillatory pattern in the cases with self-gravity. Figure 4 now shows the corresponding snapshots of density profiles in addition to velocity vector field. From this figure, we note the formation of some special structures, namely an equatorial outflow of matter, which reaches radii of up to about 80rg and is then stalled in the transonic shock. Furthermore, we notice some small inhomogeneities in the density at the chosen time intervals, which are visible in more detail in Fig. 5. The assumed black hole spin parameter in both models is A0 = 0.5, while the rotation parameter is either S = 1.4 or S = 2 for Figs. 4 or 5, respectively. Both models include self-gravity impacts. In either figure, the top images depict density snapshots of the collapsing stellar core overlaid with normalised velocity vector fields and a contour of Mach number M = 1 (i.e. sonic surface) for the sake of better representation of the transonic shock and equatorial outflow regions. Furthermore, we provide the pressure maps (the bottom profiles in both figures), which correspond to the same time steps as those of the density profiles. In this way, we investigate the possibility of some types of hydrodynamical interfacial instability (i.e. Rayleigh–Taylor (RT) or self-gravity interfacial (SGI) instability).
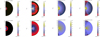 |
Fig. 4. Snapshots of density and pressure at different time steps for the self-gravitating model. The rotation parameter is S = 1.4 and initial black hole spin is A = 0.5. The top four profiles demonstrate the velocity vector field overlaid on the background of density profiles, with thick white curves as the contour plot of the sonic surface. The bottom snapshots show the pressure profiles and indicate how it varies through the inner regions, corresponding to density, which provides information on the SGI/RT instability. We note that the first and second snapshots (t = 0 and t = 0.089 s) show a larger area of about 100rg, while the other two time snapshots illustrate the zoomed-in profiles, in order to better visualise the shocked region. The model shown is A05-S14-SG-R10, as listed in Table A.1. |
In the density profiles, during the early time steps, we find an increase in density in the inner regions (r < 100rg), which show an accumulation of mass at the equatorial region. This accumulation refers to the formation of outflow as shown through backward velocity vectors surrounded by contours of Mach number M = 1. These accumulations appear in density snapshots at t = 0.089 s, as well as at t = 0.118 s and t = 0.133 s, for the cases with S = 1.4 and S = 2, respectively. We interpret the creation of outflow at the equatorial plane as being the result of centrifugal force, which is found for supercritical rotation. Consequently, a transonic shock is located within a radius of ≃100rg. In the following time steps, the density profiles show that the incoming material from outside the disc is finally channeled into this inner region, leading to a rise in the accretion rate at about 0.1 s (cf. the sharp increase in the accretion rate at early time, as shown by the thick pink and green curves in Fig. 2). As expected, for the case of higher rotation parameter S = 2, the outflow region is larger in size, and survives for a longer time (≃0.133 s). Additionally, another outflow arises at the end of the simulation for the case of higher S = 2 parameter, which leads to the outflow of matter from the envelope. This is demonstrated in the third density profile of Fig. 5 (t = 0.665 s). This causes a more oscillatory behaviour in the mass-accretion rate during the last time steps of our simulation (cf. thick green curve in Fig. 2). In comparison, for non-self-gravitating cases, in Król & Janiuk (2021), we found considerably longer lasting disc structures at the equator, which were spread out through larger radii. This confirms that there exists an interplay between self-gravity and centrifugal force (rotation), and consequently also confirms its suppressive impact on the outflow regions.
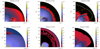 |
Fig. 5. Snapshots of density and pressure profiles similar to Fig. 4, for the model with rotation parameter S = 2 and initial black hole spin A0 = 0.5. The third snapshot (t = 0.665 s) is zoomed out to a larger area of about 1000rg, while the first two time snapshots illustrate a zoom onto 300rg for a clear representation of both outflow regions at the final time steps and improved visibility of inhomogeneities. The model shown is A05-S20-SG-R12, as listed in Table A.1. |
We notice that an inhomogeneous structure appears in both density and pressure profiles (as well as other quantities, such as specific angular momentum and Mach number). This behaviour is seen at time step t = 0.123 s for S = 1.4, and is more evident at t = 0.133 s for S = 2. For better visual representation, we show a snapshot of only the upper hemisphere in the case with S = 2, where a symmetric structure can be seen with respect to the equator (in contrast to the case of S = 1.4). Here, the inhomogeneities start growing from the interfaces with significant discontinuities in density. As a result, interfacial instabilities seem likely to be responsible for such a structure.
In general, instabilities may be divided into two types, global instabilities (such as Jeans) and interfacial instabilities (e.g. Kelvin–Helmholtz and RT instabilities). Among interfacial instabilities, RT instability occurs when density and pressure gradients act in opposite directions. This criterion can be identified through the linear growth rate proposed to examine the RT-unstable regions, which reads (Kifonidis et al. 2003):
 (20)
(20)
Moreover, Hunter et al. (1997, 1998) introduced another type of interfacial instability driven by self-gravity, called SGI instability, as mentioned above. The linear growth rate for the SGI instability is supposed to be (Hunter et al. 1997, 1998)
 (21)
(21)
The RT and SGI instabilities result in very similar configurations at density snapshots. However, they have their own characteristics, which allows us to differentiate between them. As self-gravity has no ‘preferred’ direction, it is destabilising across all density interfaces, while an interface is RT-unstable only if the heavy fluid is on top of the light fluid. It has also been confirmed that RT instability is characterised by dense spikes penetrating the tenuous fluid, whereas the SGI develops with tenuous spikes streaming into the denser fluid (Hueckstaedt et al. 2005).
As one can infer from Fig. 4, SGI instability seems to dominate over RT instability and produces the inhomogeneities. First, density and pressure profiles at t = 0.123 s confirm the finding that density and pressure gradients over the discontinuity –that appeared at r ≃ 20Rg– act in the same direction. In order to provide some further context, data for the criteria (20) and (21) are provided in Table 2, which quantify the growth rates of RT and SGI instabilities around the boundary with the emergence of growing unstable configurations (i.e. r ∼ 20Rg). To calculate σRGI, the densities ρ1 and ρ2 were taken at the centres of the neighbouring grid cells. The result for σRT also confirms the positive sign of  at these regions. Moreover, a comparison between the growth rates of RT and SGI instabilities reveals the considerably faster growth of the SGI modes, meaning that this type of instability seems a plausible candidate to drive the inhomogeneous structure. Second, it appears that tenuous bubbles penetrate into denser matter, which also points out that less dense matter lies on top of denser fluid (as can be seen in the direction of the flow in this region).
Square values of the RT and SGI growth rates for the self-gravitating case of S = 1.4 and A0 = 0.5 (model A05-S14-SG-R10).
Therefore, we argue that it is SGI instability that seems to be of faster growing modes rather than RT. Based on similar evidence, we also believe SGI instability to be the more likely mechanism behind the inhomogeneous structure in the case with S = 2, as shown in Fig. 5.
It is worth mentioning that we considered this configuration as an approximately linear growth of SGI modes, which is due to SG rather than a non-linear turbulent structure. Tracing the velocity vector fields through different time steps also confirms no detectable non-linear interaction between the fluid elements; that is, there does not appear to be a significant chaotic direction in the velocity vectors. Therefore, we believe that, although the creation of such an oscillatory pattern might be due to a non-linear interaction (mixing) of the fluid elements with different amounts of angular momentum (we discuss this further in the following section), this can be taken as a very weak and transient turbulent behaviour, and so the linear approximation used to calculate the growth rates appears justified.
Finally, we note that the polytropic equation of state (EOS) used in our numerical simulation implies that entropy is conserved and no shock heating due to entropy generation can occur. Alternative forms of EOS could alter our stability analysis, as the kinetic energy evolution would affect the shock expansion pattern.
4.2.2. Self-gravity and angular momentum transport
Self-gravity is expected to play a role in angular momentum transport; for example, that in protoplanetary discs (Armitage 2011). In general, the transport of angular momentum can be driven by either hydrodynamics (HD) or magneto-hydrodynamic (MHD) instabilities, which both produce a turbulent structure leading to transition of this kind. Self-gravity can also lead to angular transport by promoting gravitational instabilities (Lodato 2008), in addition to the SGI instability discussed above. We postulate that self-gravity facilitates the transfer of angular momentum in our collapsing scenario. Figure 6 shows the specific angular momentum of the envelope at the equator for two cases, namely with and without self-gravity. The top panels show models with S = 1.4, while plots on the bottom present models with S = 2. Comparing those two cases with non-SG models (with plots located in the left), we show that self-gravity paves the way for the angular momentum to be transferred outwards, as we can observe at larger radii. On the other hand, during the intervals when the density inhomogeneities emerge (i.e. in the range of t = 0.118 s − 0.148 s), there seems to be a sudden decrease in the profile of the angular momentum in the innermost regions. This can be interpreted as sudden transport of the mass and angular momentum towards the black hole. However, an upward trend is seen once the inhomogeneities disappear (i.e. from t = 0.163 s afterwards).
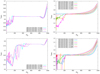 |
Fig. 6. Specific angular momentum at the equator taken at several time steps corresponding to the inhomogeneous structure in the self-gravitating case (right panels in both rows). The cases without self-gravity are also presented in the left two panels. Two cases of S = 1.4 and S = 2 with A0 = 0.5 are shown in the top and bottom panels, respectively. During the emergence of inhomogeneities, self-gravity seems to transfer the angular momentum into the black hole. Models are labelled in all panels with symbols referring to Table A.1. |
More precisely, we think that self-gravity has two major impacts (SG) on the specific angular momentum. First, SG models accelerate the evolution of the envelope considerably, so that the inward mass transfer and outward angular momentum transfer occur within a shorter period of time with respect to the non-SG models. This results in a larger increase in the specific angular momentum of the outer region from one time step to another in comparison to the non-SG models. Therefore, we may attribute differences in specific angular momentum at larger radii –illustrated in Fig. 6 for the cases with and without self-gravity– to this issue. We believe that the faster evolution in SG models is due to the suppressing impact of SG on the centrifugal force, which also explains the longer lasting outflow of matter around the equator in non-SG models (one may attribute the production of outflow to the centrifugal force, which results in the slower evolution of non-SG models).
Second, the instabilities that occur due to SG effects, that is, ring-like gravitational instability (which leads to very small-scale ring-like structures; see below) followed by SGI instability (that leads to the formation of inhomogeneous structure of the inner envelope), can affect the angular momentum transport of inner region, and consequently controls the early-time accretion rate onto the black hole (which can be traced in the time domain of 0.1 − 0.2 s in Fig. 2). More precisely, once a very transient and small ring-like structure appears due to the gravitational instability (with growing axisymmetric modes), as can be seen in next section, we find that the accretion rate stops the highly increasing trend at around t = 0.118 s (see Fig. 2). On the other hand, such a transient ring-like configuration can also be interpreted as an increase in the angular momentum of the inner side of this ring. Subsequently, as the inhomogeneities grow in the inner region (from ∼0.118 s to ∼0.148 s), the bubbles with lower angular momentum (this can be detected from images in Figs. 7 and 8) increase in number at the equatorial plane as well as other zones. We argue that such a mixing of layers with different densities and angular momentum, besides offering the lowest energy configuration, causes the angular momentum to be transferred from the fluid elements with a larger amount of angular momentum to the bubbles with lower angular momentum when they meet at the same radii. This yields an inward transport of angular momentum. In contrast, at time steps during which the inhomogeneous structure starts to disappear (from ∼0.163 s up to ∼0.192 s), one can find a rise in the specific angular momentum, and a return to a stabilised configuration. The inward transport of angular momentum in turbulent mixing fluids has been discussed by Balbus (2000, 2003), for example. According to the analysis performed by Balbus (2000), the process of turbulent angular momentum transport involves mixing of the fluid elements at some intermediate radius (cf. Figs 1 and 2 in their paper). Therefore, the non-linear interaction of fluid element mixing causes a loss (or gain) of specific angular momentum. In our case, we find that the production of inhomogeneous structure involves mixing of fluid elements from off-equatorial regions with a lower amount of angular momentum, which penetrate the fluid layers that have a larger amount of angular momentum. This behavior may be considered as a very transient, weak, turbulent and non-linear mixing of the fluid elements in our simulation, meaning that our profiles of velocity vectors do not reflect any remarkable chaotic motion of the fluid layers sufficient to provide a significant turbulent structure. Regarding the outward increasing manner of the angular momentum in our case, in addition to the direction of the velocity vectors of the fluid elements in this region, we argue that bubbles with lower angular momentum from the inner radii will gain angular momentum from the fluid in the outer layers of larger angular momentum when they meet at the same radii on the equator. This can be interpreted in a similar way to the second situation discussed by Balbus (2000), which confirms an inward transport of angular momentum.
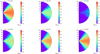 |
Fig. 7. Specific angular momentum snapshots, for the model with a self-gravitating collapsing stellar core with S = 1.4 and A0 = 0.5. In a time interval between the second and the fifth snapshot, an inhomogeneous structure in the inner region can be detected, indicating the effects of self-gravity. The model shown is A05-S14-SG-R10, as listed in Table A.1. |
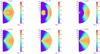 |
Fig. 8. Specific angular momentum snapshots for the model with a self-gravitating collapsing stellar core with S = 2 and A0 = 0.5. The inhomogeneities demonstrate self-gravity impacts, as seen in the second and third time snapshots. The model shown is A05-S20-SG-R12, as listed in Table A.1. |
Figures 7 and 8 show snapshots of the specific angular momentum distribution for these two models. Here, we show the self-gravitating models. The specific angular momentum starts decreasing through an inhomogeneous configuration from t = 0.118 s to t = 0.148 s and adopts an increasing trend thereafter, as pointed out above. In the model with higher rotation of the star’s envelope, the inhomogeneous structures in angular momentum distribution seem to be smoothed out more quickly, and by t = 0.177 s they disappear.
4.3. Analysis of gravitational stability
In self-gravitating collapsing stellar cores, gravitational instability can provide different structures, such as an axisymmetric ring formation or non-axisymmetric spiral arms, called I-modes, or fragmentation, which can be referred to as J-modes and identified with the Jeans mechanism of instability (Hachisu et al. 1987; Christodoulou & Narayan 1992). The so-called Toomre parameter,  , where κ is the epicyclic frequency, cs the local sound speed, and Σ the surface density, has been introduced for the axisymmetric local instabilities in geometrically thin discs (Toomre 1964). Later on, Hachisu et al. (1987) proposed a universal criterion for gravitational instability, which is valid in both thick and thin systems:
 (22)
(22)
where κ2 = 4Ω2 + rdΩ2/dr. These latter authors argued that non-axisymmetric fragmentation in rapidly rotating systems is generally triggered by the onset of ring formation (as the axisymmetric consequence of the gravitational instability).
Considering the importance of gravitational instability in self-gravitating accretion systems, we investigated the possibility of axisymmetric disc formation and ring fragmentation in our 2D collapsar scenario. This could consequently provide us with an estimate for the non-axisymmetric fragmentation. In spite of the fact that our stellar core is set up in 2D, the latter can be considered a possible outcome of a 3D setup (planned future work).
Figure 9 demonstrates where the axisymetric mode’s condition, given by Eq. (22), is satisfied We plot its behavior on the equatorial plane for several time steps. Here, we are comparing cases with and without self-gravity. To consider any possible connection with the emergence of density and angular momentum inhomogeneities, we also mark the profiles ‘Homo’ and ‘InHomo’, which signify homogeneous and inhomogeneous structures, respectively. Additionally, in cases without self-gravity, we did not find any possibility for the formation of axisymmetic modes, as shown by the smaller inset plots in Fig. 9.
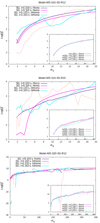 |
Fig. 9. Demonstration of how the condition for axisymetric modes (κ2/πGρ < 1) is satisfied at the equator in some time steps, considering both cases with (solid lines) and without (dashed inset curves) self-gravity. ‘Homo’ and ‘InHomo’ refer to homogeneous and inhomogeneous structures, respectively. We note the logarithmic scale on the vertical axis. Models are labelled in all panels with symbols referring to Table A.1. |
One can find that the inner regions are unstable towards ring formation, just before the inhomogeneities start arising. For higher rotation parameter S, the unstable region moves outwards and the collapsing star is prone to becoming unstable at earlier times. However, we did not detect any unstable region for the case of S = 2, as can be found from the plot at the bottom of Fig. 9. The gaps in this case appear to be related to the emergence of inhomogeneities at the equator in the corresponding time steps. Considering the increase in the spin parameter A0 for a given S parameter, a smaller axisymmetric instability region would appear. Based on Hachisu et al. (1987), we argue that as soon as the condition for axisymmetric ring formation is met, non-axisymmetric fragmentation can be possible. However, to properly investigate this matter, we would need a 3D setup of the collapsing stellar core, which is beyond the scope of the present work. To provide clues as to what might happen through the unstable regions, while we consider the axisymmetric modes, we present density profiles at the time t = 0.118 s in Fig. 10. This seems to be an unstable time snapshot for these three cases of rotation parameter, S = 1, 1.4, and 2, from top to bottom, respectively.
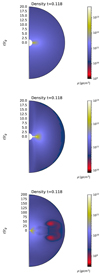 |
Fig. 10. Density profiles at the time t = 0.118 s for three cases of S = 1, 1.4, and 2 related to the images at the top, middle, and bottom, respectively. These snapshots illustrate the density structure of the envelope when the ring-like gravitational instability becomes possible. However, the case with S = 2, i.e. the last profile, shows no axisymmetric growing mode. Models shown from top to bottom are A05-S10-SG-R12, A05-S14-SG-R10, and A05-S20-SG-R12, as listed in Table A.1. |
4.4. Simulations of magnetised collapsing stars
We now investigate the role of the magnetic field and its importance from the point of view of the gravitational stability of the collapsing core. Here we present the general trends of the system evolution, starting from the simplest case of a weak uniform magnetic field, given by Eq. (17). Figure 11 shows the time evolution of the black hole mass, spin, and mass-accretion rate onto the black hole for the two values of specific angular momentum in the collapsing star, S = 1.0 and S = 2.0, and we compare the system evolution with and without the self-gravity term. The initial gas-to-magnetic-pressure ratio is β = 10 and the initial black hole spin is a = 0.85 in all models. In general, the larger specific angular momentum results in smaller final black hole mass and larger final black hole spin (although net spin-down is found in all cases). The self-gravitating stellar core evolves much faster, and the final value of black hole spin is reached already after the initial ∼10 000 tg. Also, in the case of self-gravitating collapsing cores, the instantaneous accretion rate presents much larger amplitudes of oscillations during the period of steep increase in black hole mass.
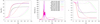 |
Fig. 11. Time evolution of the black hole mass (left), accretion rate onto the event horizon (middle), and black hole spin (right) for the rotation normalised with specific angular momentum at ISCO S = 1.0 and S = 2.0 (models are labelled in the middle panel with symbols referring to Table A.1). The initial spin of the black hole was A0 = 0.85, and the initially vertical magnetic field given by Eq. (17) was normalised with β = 10 or β = 100 at the ISCO radius. |
We also examined the influence of self-gravity on the global density profile and the shape of the magnetic lines. Self-gravity modifies 2D profiles of density or other quantities noticeably at two stages of the evolution. For all of the combinations of A0, S, and gas-to-magnetic pressure values, the self-gravity shows its effect for the first time around t = 0.133 s by creating inhomogeneities. At this stage, the presence of the magnetic field does not significantly change the influence of self-gravity. The structure and duration of the profiles are similar in the simulations with and without magnetic field and they are only visible at small scales of around ∼100rg. Around t ∼ 0.148 s, we see a drop in the angular momentum, which is not reflected in the density profile, and higher values appear again around t ∼ 0.163 s. Inhomogeneities disappear around t ∼ 0.192 s and the magnetic field does not have a significant influence on the evolution at that time. Inhomogeneities have the same structures and morphology as those seen in Fig. 7 for a non-magnetised case (model A05-S14-SG-R10).
Self-gravity makes its presence known for the second time at the end of the simulations. This timing of the effect depends on the presence and strength of magnetic field. For the simulations without self-gravity in the final stage of the simulation, the approximately spherically symmetrical structure of the density is preserved, and magnetic potential lines are radial. There is a situation change for the self-gravity profiles. With the absence of the magnetic field, we observe a thin disc-like structure, which forms at the end of the simulations. For the magnetic field characterised by β = 100, a similar structure is formed, and its shape is followed by the magnetic potential lines. However, this latter structure is slightly bigger than in the non-magnetised case. A more magnetised envelope with β = 10 results in a structure that is visible at scales of up to r ∼ 800rg. Moreover, simulations with self-gravity leave a much lense dense evolved stellar core. We present exemplary profiles illustrating those stages of the simulations for A0 = 0.3 and S = 1.0 in Fig. 12. The models shown here are A03-S10-nSG-R12, A03-S10-nSG-wMF, and A03-S10-nSG-sMF in the top row and models A03-S10-SG-R12, A03-S10-SG-wMF and A03-S10-SG-sMF in the bottom row.
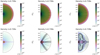 |
Fig. 12. Density profiles with the contours of the magnetic field vector potential at the final stage of the simulations. The first row presents simulations with no self-gravity and either no magnetic field (left panel), β = 100 (middle panel), or β = 10 (right panel). The second row presents simulations with self-gravity and either no magnetic field (left panel), β = 100 (middle panel), or β = 10 (right panel). The simulations assume a vertical magnetic field configuration. Parameters: A0 = 0.3, S = 1.0. The models shown are A03-S10-nSG-R12, A03-S10-nSG-wMF, and A03-S10-nSG-sMF (top row), and A03-S10-SG-R12, A03-S10-SG-wMF, and A03-S10-SG-sMF (bottom row), as listed in Table A.1. |
In addition to the vertical magnetic field configuration, we computed the evolution of a collapsing star embedded in a dipole magnetic field given by Eq. (19). Figures 13 and 14 present the initial and evolved states of magnetised models with a dipole configuration. This configuration seems more natural for a stellar structure at large scale in the envelope, and was not considered in our previous study (Król & Janiuk 2021). In the presented models, the initial black hole spin is assumed equal to A0 = 0.85, and specific angular momentum is normalised with S = 1.0 or S = 2.0. Figure 13 shows snapshots from the model with self-gravity effects neglected, while Fig. 14 shows the model where the self-gravity effect is included. The dipole field is a prospective configuration of the field in the context of stellar collapse models (White et al. 2022). We notice that, in comparison to the uniform field configuration, the general evolution of the system is similar. Small quantitative differences appear in the final black hole mass and spin, as well as in the average accretion-rate values. In non-self-gravitating models, the maximum accretion rates (we probed only the case of initial spin A0 = 0.85 and envelope rotations S = 1.0 or S = 2.0) seem to be slightly larger for the dipole field than for the vertical magnetic field. The maximum black hole spin value does not change, but the final spin of the black hole in general can be slightly larger (by ∼0.02), and the final black hole mass decreases slightly for S = 1.0. In case of S = 2.0, the trend reverses, and the final black hole mass is larger, while the final spin is smaller (even by ∼0.06). Detailed values are given in Table A.1. Noticeably, for dipole field normalised to a maximum gas-to-magnetic field ratio at the event horizon, the results with the dipole field do not depend on this normalisation.
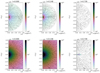 |
Fig. 13. Distribution of density and magnetic field vector potential contours at t = 0 (left), and the short-time evolved snapshots taken at time t = 0.148 s (middle), and at the end of simulation time t = 0.739 s (right). The magnetic field of dipole configuration is adopted and normalised with β = 50. Top row is scaled to the outer radius of the domain, at 1000rg, and bottom row is zoomed in to 100rg. Simulation was done in an evolving Kerr metric, but without the self-gravity effect. Parameters: A0 = 0.85, S = 1.0. The model shown is D08-S10-nSG-b50, as listed in Table A.1. |
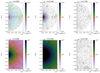 |
Fig. 14. As in Fig. 13 but with the self-gravity effect. The model shown is D08-S10-SG-b50, as listed in Table A.1. |
In Figs. 15 and 16, we present the initial and evolved states of magnetised models with a Wald configuration as given by Eq. (18). We notice that, in this case, magnetic field acts as a barrier and prevents material from accreting onto the black hole. A repulsive effect of the black hole magnetosphere is seen in both simulations, with and without self-gravity. Therefore, the mass of the black hole does not change during the simulation (cf. Table A.1).
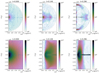 |
Fig. 15. Distribution of density and magnetic field vector potential contours at t = 0 (left), and the short-time evolved snapshots taken at time t = 0.148 s (middle), and at the end of the simulation at t = 0.296 s (right). The magnetic field of the dipole configuration is adopted and normalised with β = 50. The top row is scaled to the outer radius of the domain, at 1000rg, and the bottom row is zoomed in to 100rg. The simulation was done in an evolving Kerr metric, but without the self-gravity effect. Parameters: A0 = 0.85, S = 1.0. The model shown is W08-S10-nSG-b50, as listed in Table A.1. |
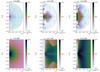 |
Fig. 16. As in Fig. 15 but with self-gravity effect. Model shown is W08-S10-SG-b50, as listed in Table A.1. |
In the case of the dipole magnetic field shown in Fig. 13, the accreting torus is formed at the equatorial region close to the black hole; its size is rather small. The magnetic flux brought to the event horizon is not sufficiently large to power a successful jet. We checked that the dimensionless magnetic flux, that is, scaled to the mass flux on the event horizon,
 (23)
(23)
is at most about ϕBH ∼ 5 in all models, and very quickly drops to zero during the evolution. On the other hand, a larger dimension magnetic flux of ϕBH > 15 is presumably needed to form a magnetically arrested state and to drive the launch of relativistic jets from the collapsar’s central engine and power a gamma ray burst (Janiuk 2022b).
It is beyond the scope of the present paper to investigate in more detail the evolution of a magnetically arrested state of the accretion flow, especially in the case of a self-gravitating collapsar. We plan to study this scenario in a separate work, and verify whether such a configuration can possibly give rise to a long-lasting jet launched from the event horizon. For now, we only verify that, for self-gravitating models embedded in dipole magnetic field, a slightly larger ϕBH (albeit still smaller than the ‘canonical’ value of 15) is reached at the beginning of the simulation, if only we normalise the models with maximum magnetisation, σ = b2/ρ (instead of the maximum gas-to-magnetic pressure ratio). We also list those models in the Table A.1. We conclude that a purely dipole field is still unable to support the launch of relativistic jets from self-gravitating collapsars unless the field at the core of the star is amplified and reconfigured. However, such conclusions should be verified by fully 3D simulations similar to those presented in Gottlieb et al. (2022). The dipole magnetic field prescription described by these latter authors has been modified with a factor that depends on the radius in order to disentangle the magnetic field of the stellar core from the dipole-like field of the envelope (cf. Eq. (10) in their article).
We propose that the magnetic field preserved by the collapsing stellar core, which forms a black hole, might be reconfigured during collapse and for a Wald magnetosphere. There, the repulsing effect of such a field would act on matter if the black hole were spinning sufficiently fast (Karas et al. 2020).
Figure 17 shows the time dependence of the magnetic flux of the horizon for the above-mentioned configurations with two values of magnetisation, σ = 1 and 0.1. For comparison, we also checked the magnetic flux level in the case of our third magnetic field configuration, the Wald solution given by Eq. (18), which is thought to accurately describe the magnetosphere of a quickly spinning black hole.
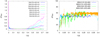 |
Fig. 17. Time evolution of the magnetic flux at the black hole horizon normalised to the mass flux (see Eq. (23)). Models are normalised with specific angular momentum at ISCO S = 1.0 and S = 2.0 (as labelled in the panels). The initial spin of the black hole is A0 = 0.85. The initial magnetic field is dipole, given by Eq. (19), and normalised with maximum magnetisation of σ = 1 or σ = 0.1 (left panel), or is a vertical field, given by Eq. (18), and normalised with gas-to-magnetic pressure ratio at ISCO equal to β = 50. Models are labelled in both panels with symbols referring to Table A.1. |
In the numerical simulation, the Wald magnetic field confines a large-scale toroidal structure in the equatorial plane, which is present for most of the simulation time. A temporary jet-like structure forms in the polar regions in the early time of the simulation. A low-density funnel is formed along the rotation axis of the black hole, and reaches a distance of about 250rg. In this simulation, the magnetically arrested state developed and a dimensionless magnetic flux of ϕBH ∼ 50 was reached at the horizon region. These high values were obtained in both self-gravitating and non-SG models, regardless of the specific angular momentum content in the envelope. Still, the magnetic field did not prevent matter from collapsing through the polar and intermediate-latitude regions, and so dense material was later present below and above the torus. This material ultimately halted the jet that was at the point of emerging from the black hole. Again, 3D simulations might lead to different conclusions, and these will be studied in future work. Specifically, in the case of a highly magnetised collapsar, where initial magnetisation is normalised to σ = 0.1, dense material should not fall onto the centre from the poles, but be expelled outwards. The jet would then be more likely to break out, in the form of a persistent or transient structure, which may not be the case for less magnetised material. To study this effect in detail, a 3D simulation with finer resolution and possibly adaptive mesh refinement would be needed.
4.5. Global trends across the black hole spin scale, angular momentum content, and magnetic field strength
In the three previous subsections, we discuss the dependences of the collapsing stellar core properties separately for each black hole spin. We also use several values of the angular momentum content in the pre-collapse star, and several prescriptions of the initial magnetic field configuration and strength.
Here we propose a synthetic, quantitative way to examine the influence of self-gravity on the system. We check the relative differences between global resulting quantities: final black hole spin, Afinal, maximal black hole spin, Amax, and the maximal black hole mass, MBH, calculated for the simulations with and without self-gravity. We show three cases with different input of the magnetic field, as presented in Fig. 18 (the top row shows non-magnetised case, and the middle and bottom rows differ with respect to the β0 parameter to which the vertical field is normalised). We show the colour maps of those three global quantities in the parameter space defined by the model parameters: A0 and S.
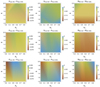 |
Fig. 18. Density plots showing the difference of Afinal (left panels), Amax (middle panels) and MBH (right panels) between SG and nSG models for simulations without magnetic field (upper row), with magnetic field normalised to β = 100 (middle row) and for β = 10 (lower row). |
We note that the final spin of the black hole is always smaller in simulations with self-gravity. The magnetic field input enhances this difference, especially for models with a higher rotation parameter, and regardless of the initial black hole spin. In other words, the relative difference between final spins is negative and spans larger parameter space if the magnetic field is present in the collapsing stellar core. The reason for this is the action of the magnetic barrier, which pushes the infalling gas outwards; hence the temporary decrease in the mass-accretion rate. The effect on the black hole angular momentum is negligible, but the dimensionless spin A is reduced.
The behaviour of the final black hole mass and the maximal spin is more complicated and depends on the combination of the A0 and S parameters. Amax is higher for self-gravitating models with A0 ∼ 0.6 and high values of S than for non-magnetised models. However, when the initial spin is very low or very high, the maximum spin Amax is higher for models without self-gravity. In weakly magnetised and non-magnetised models, the relative differences become roughly zero, as shown in the top row of Fig. 18.
Similarly, the maximal black hole mass in most cases is lower for the simulations with self-gravity, but again we can see different behaviour for the simulations with high S and stronger magnetic field. The relative difference between the resulting quantities is enhanced by the magnetic field.
In summary, as shown in Fig. 18, the self-gravity can be interpreted as a factor that lowers the final mass and spin transferred into the black hole, while it may increase the maximum spin parameter of the black hole with respect to the non-self-gravitating case. On the other hand, we find that a sharp decrease in the accretion rate at time t ≳ 0.2 s, which appears in the self-gravitating case (see the second plots of both rows in Fig. 2), coincides with an increase in the specific angular momentum of the inner radii. This suggests that the accretion of matter onto the black hole may take a longer time than that which we considered for the whole simulation, meaning that the final mass of the black hole is clearly less than in the non-self-gravitating case. We believe that it may also cause a further decrease in the final spin of the black hole. However, considering the higher maximum spin parameter in the self-gravitating case, we come to the conclusion that at the earlier time steps (≲0.15 s), the self-force of the envelope seems to pave the way for the angular momentum to be transferred onto the black hole due to the fact that an increasing amount of mass falls inside the horizon as a result of the higher accretion rate. Regarding magnetic field effects, these appear to influence these parameters in both cases with and without self-gravity. However, for the self-gravitating case, this impact is rather more complicated than for the non-self-gravitating case. On the one hand, self-force acts against magnetic field because it causes the matter to become denser, which is against the role of magnetic field on small scales. On the other hand, one may expect the magnetic field to decrease the accretion of matter towards the black hole due to the large-scale effect of magnetic torque on the envelope. This type of influence agrees with the previously mentioned increase in the specific angular momentum of the inner radii when self-gravity is taken into account, at the time steps ≳0.2 s. In general, we find that the impact of self-gravity dominates over that of the magnetic field, meaning that it influences the non-self-gravitating case more than the self-gravitating one. This may result in an increase in the relative difference between black hole features when studying two cases side by side, with and without self-gravity.
5. Discussion
In this work, we present a new version of our time-dependent code, which is based on the HARM scheme but supplemented with the dynamically evolving space-time metric coefficients, as described and developed originally by Janiuk et al. (2018) and later explored in Król & Janiuk (2021). The significant modification presented here is designed to numerically account for the Kerr metric perturbation due to the gravitational self-force acting on the matter inside the orbit of a given fluid element. This self-gravity changes with the distance from the black hole. Our dynamical treatment of the metric perturbation does not provide a method of solving the full set of Einstein field equations, such as is possible in the Einstein Toolkit1 framework. Nevertheless, we argue that it provides a good approximation to the collapsar problem and allows us to compute the stellar collapse with a wide range of black hole spin parameters and takes into account the dynamical evolution of the black hole mass and spin, while the mass of the self-gravitating envelope, which imposes the perturbation in the Kerr metric, is non-negligibly large. Such a calculation is, to the best of our knowledge, currently not possible with other methods.
In this paper, we compare the new results with the cases where the self-gravity perturbation is neglected, and we find dramatic differences between these two cases, mainly in the early phase of the collapsing star time evolution. We also focus on the potential role of the gravitational instability in collapsing stellar cores across a broad range of values of the initial spin of the black hole. We study both non-magnetised and magnetised models. In the latter case, we explore in more detail the self-gravitating collapsing stars embedded in an initially vertical magnetic field in order to be able to compare them quantitatively with our previous results, where only this magnetic field configuration was used. In addition, we adopt an alternative configuration of a dipole magnetic field, which we assume to be more adequate for large-scale field initialisation in collapsing stars. Nevertheless, we find that this configuration itself does not lead to the magnetic flux being brought into the black hole horizon, which would be large enough to account for magnetically arrested state formation (Janiuk 2022b). The most promising way to produce bipolar jets powered by magnetised accretion originally seeded in the stellar magnetic field and able to emerge from the collapsar envelope is therefore a hybrid configuration, such as the one proposed in Gottlieb et al. (2022). Exploring such models should be done in a 3D setup, which is more computationally demanding. We note that, when we account for self-gravity, apart from the Kerr metric changing because of black hole growth, two additional equations for perturbation of mass and angular momentum have to be solved and integrated over the volume in each grid point. Both cases have only been studied so far in 2D. We defer the 3D task to future work.
In our self-gravitating models, we assume an accreting black hole with an initial mass of 3 M⊙, which is slightly larger than the maximum possible mass of a neutron star, and ensures that our core collapses directly onto a black hole. After that, the compact object increases in mass due to the fallback of the stellar envelope. Our adopted model assumes the envelope mass is fixed and equal to 25 M⊙. This mass is smaller than that of a typical core-collapse supernova, while it is adequate for the massive star that has been already stripped of its hydrogen envelope (Podsiadlowski et al. 2003). Therefore, regarding the black hole growth, we allow for a change of its mass up to this possible value of about 28 M⊙, which is found to be towards the lower end of the mass distribution of black holes detected by gravitational wave interferometers (10–85 M⊙, Abbott et al. 2020).
The initial spin of the newly formed black hole is our model parameter and ranges from 0.3 to 0.85. We do not start from a non-spinning black hole, as we did in our previous work (e.g. Murguia-Berthier et al. 2020), because in general we are more interested in the electromagnetic counterpart of the collapse in the present study, which is found in the form of a GRB event that is presumably powered by a spinning black hole. The spin changes during the collapse because of accretion of the envelope, where some content of the angular momentum was already available. As the stellar rotation is parameterised in our models by the ratio between the given specific angular momentum and the critical rotation speed at the ISCO, while on the other hand, a moderately rotating black hole was already seeded in the core, the ultimate outcome of the process naturally depends on the two-parameter space, namely S and A0. This parameter space was explored in our set of simulations, while we also aimed to break the degeneracy between these parameters by introducing magnetic field in some of the models.
Our simulations are started with the smooth transonic solution, when the gas radial velocity is supersonic within the inner 80 gravitational radii. This is different from a multi-transonic shock solution, as introduced in the simulations of Suková & Janiuk (2015), which would naturally lead to shock oscillations. Here, we observe the sonic front expansion, and also some transient shock formation during the collapse. At early times, the small transonic shocks appear to be located around 100rg; they present a moderate density contrast (pre-shock to post-shock density ratio R = ρ1/ρ2 ∼ 10). Such shocks also appear at later times during collapsar evolution. We find that their formation is enhanced by the self-gravity effects. Regarding the impact of magnetic field, we find that it does not make any significant difference on these timescales, although it may influence the strength of the transient shock that appears in the case of high rotation, S = 2. This comparison can be confirmed by Fig. 19, which indicates the radial evolution of density and Mach number through the early stage of the simulation. The left-hand plots are associated with the self-gravitating case, while the right-hand plots also contain the effects of magnetic field. This impact of the magnetic field on shock strength is consistent with previous studies. In addition, we find that the density contrast in our weakly magnetised models is found to be smaller than in the non-magnetised ones, which supports the polytropic EOS approximation.
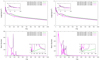 |
Fig. 19. Radial profiles of Mach number and density at some specific time snapshots, or models with S = 2 and A0 = 0.5. The left panels show the curves in the self-gravitating case, while the plots in the right panels show the curves in the self-gravitating magnetised case. For the sake of increased visibility, we provide zoomed-in inset panels representing the inner regions. Models are labelled in the all panels with symbols referring to Table A.1. |
We therefore note that magnetic field does not significantly change the properties of the inhomogeneous region. The latter conclusion regarding magnetised shocks is consistent with the Fermi acceleration process studies carried out for pulsar wind nebulae. As found by Sironi & Spitkovsky (2011), the particle acceleration in magnetised shocks leads to lower speed and energy for larger magnetisation, σ. Moreover Komissarov (1999) showed that, even for moderately magnetised plasma, the formation of the strong shocks is different from in the purely hydrodynamical case. In our models, the typical magnetisation is weak, σ < 1, but in the early times of collapse, the shocks that form in the innermost regions of the star still have larger density contrast in non-magnetised cases.
Several scenarios have been proposed to explain the temporal variability of the GRB light curves. Such fluctuations are detected in both prompt emission of gamma rays and flaring activity in X-ray or optical bands. The internal shock model (Piran et al. 1993; Katz 1994), turbulence or magnetic reconnections in the jet (Narayan & Kumar 2009; Beloborodov et al. 1998, 2000; Amati et al. 2018), and viscous and thermal instabilities in a hyperaccretion disc as the GRB central engine (Janiuk et al. 2007; Lei et al. 2009; Kawanaka & Kohri 2012; Kawanaka et al. 2013) are some of the mechanisms proposed to model this erratic behavior. As suggested already by Perna et al. (2006), the phenomenology of short and long gamma ray bursts indicates that the gravitational instability in their engines may lead to the flaring activity (Margutti et al. 2010). In particular, the self-gravity can lead to a clumpy structure (see also Shahamat & Abbassi 2020 for the case of flaring activity, Shahamat et al. 2021 for the prompt emission variability, and Coughlin et al. 2020 regarding cases of the oscillatory behavior of flares and prompt emission) or spiral density waves (Masada et al. 2007) in the central engine. However, this activity perturbation may be further modulated by the jet breakout from the star (Petropoulou et al. 2020). What is then measured in the data is the amplitude of the count rate for the variability observed in jets of GRBs, and this amplitude depends strongly on the selected energy band. About 30% of GRBs present X-ray flares whose origin is now a subject of discussion. The longest of them, lasting a few hundred seconds, are attributed to the reverse shock emission, while the following plateau phase –seen in optical and X-ray bands– may be related to the late central engine activity in GRB180205 (Becerra et al. 2019).
Prompt gamma-ray emission typically exhibits a stochastic variability described by a Poisson noise. The variability timescale is estimated to be of the order of < 10 s down to 10 ms (Bhat et al. 2011; Golkhou & Butler 2014). This naturally gives rise to clustering, that is, time intervals characterised by an intense activity with a high rate of peaks are interspersed with quiescent periods during which the rate drops significantly (Guidorzi et al. 2015). The high-energy variability and late X-ray flares are related to each other, and presumably they simply represent different fragments of the GRB central engine, being accreted at the beginning and at the end, respectively, and are likely a result of the same mechanism. In our calculations, the central engine is represented by the innermost parts of the collapsing star enclosed within the computational domain. The very first fragments of the self-gravitating star will lead to the prompt emission variability on the scale of 0.1–0.2 s, while the black hole spin is also changing over time. The remaining parts of the envelope, additionally broken into further fragments and rings over larger inhomogeneities, should lead to longer timescale variability. In this phase, the black hole spin should reach a final value, and the process of energy extraction to the jets should not be affected by the spin changes. Therefore, the extended quiescent period of the prompt emission could be followed by several subsequent pulses, when the matter clumps incoming from the outermost regions of the engine eventually fall onto the black hole, likely delayed by the viscous spreading (Dall’Osso et al. 2017). Flares occur therefore 100 − 1000 s after the prompt emission, while the light curves are generally of around > 10 s length.
Our study identifies several key factors that may influence accretion-rate variability and potentially explain the oscillations in prompt emission. First, the barrier between the gravitational torque of the black hole and the centrifugal force, which pushes matter outwards especially in the cases of higher rotations (i.e. S = 1.4, 2) and near the equator, causes some fluctuations in the size of the outflow, while this region shrinks due to the dominance of the central gravity. These fluctuations can produce a pulse with a duration of around ≲0.05 s. In cases without self-gravity, on the other hand, the outflow zone moves outwards, and shrinks in a more stable manner over a longer period of time. Consequently, the accretion rate is much smoother, with a variability of the order of a few 10−1 s (see the right-hand panel of Fig. 2). We identify this factor as the only one responsible for the smooth variability of the accretion rate in the absence of self-gravity. Second, the inhomogeneous structure of the inner stellar core due to SGI instability, in addition to the creation of transient shock (seen in the earlier time steps of the case S = 2), leads to a variable accretion rate. We estimate that the former generates a pulse of less than ∼0.074 s in duration (regarding the period of time during which the specific angular momentum through the inner regions encounters a drop, as demonstrated in Fig. 6) and the latter provides a variability of the order of ∼10−2 s. On the other hand, shocks are considered as another factor that can lead to short-term variability and also a high efficiency of energy conversion in astrophysical accreting systems, such as active galactic nuclei (Meszaros & Ostriker 1983). In conclusion, we are of the opinion that the short-term variability of the prompt emission of GRBs can be well explained in terms of these mechanisms.
6. Conclusions
We studied models of the collapsing stellar core that specifically account for the changing black hole mass and spin, the related coefficients of the Kerr space-time metric, and, for the first time, the self-gravity of the star. In the main part of this analysis, we compared our new results to the cases without the self-gravity terms. We also analysed the impact of SGI instability on the properties of the collapsing flow. In addition, some of our models were embedded in magnetic fields of various strengths and initialized with several configurations.
The main findings of this study can be summarised as follows.
-
We show that the evolution of the spin and mass of the black hole are quantitatively and qualitatively affected by the self-gravitation of the envelope.
-
We show that accretion-rate variability at early times is much stronger in self-gravitating collapsing stars and may lead to detectable signals in long GRB prompt emission.
-
We find that self-gravity effects provide a mechanism for the transport of angular momentum, and that final black hole mass and spin are reached much earlier during the collapse.
-
We see a weak and non-linear dependence of the black hole evolution on its initial spin, which is most clearly seen when a magnetic field is present in supercritically rotating envelopes.
-
We detect the formation of transient shocks with a moderate density contrast, even in magnetised models.
-
At early times of the simulation, the density contrast in transonic shocks seems to be higher in non-magnetised cases.
Our computations confirm that gravitational instability can account for flaring activity in GRBs and the variations in their prompt emission. The rapid variability detected the brightest GRBs (most likely powered by rapidly spinning black holes) is consistent with the self-gravitating collapsar model, where the transonic shocks are formed. Our findings suggest the effect should be weakened by magnetic field.
Acknowledgments
We thank Jonah Miller, Petra Sukova and Ishika Palit for helpful discussions. We also thank the anonymous referee for careful reading of our manuscript and important feedback. The project was partially supported by grant 2019/35/B/ST9/04000 from Polish National Science Center. We made use of computational resources of the PL-Grid infrastructure, under grant plggrb5. Additionally D. Ł. K. was supported by the Polish National Science Center Dec-2019/35/O/ST9/04054. This work is based upon research funded by Iran National Science Foundation (INSF) under project number No.4013178. N.Sh.D acknowledges Ferdowsi University of Mashhad (FUM), Iran, and the FUM Sci-HPC center where some part of this research was performed. Shahram Abbassi also deserves gratitude for his accompaniment to N.Sh.D. in this project. A.J. acknowledges the Czech-Polish mobility program (MŠMT 8J20PL037 and PPN/BCZ/2019/1/00069).
References
- Abbott, R., Abbott, T. D., Abraham, S., et al. 2020, ApJ, 900, L13 [NASA ADS] [CrossRef] [Google Scholar]
- Amati, L., O’Brien, P., Götz, D., et al. 2018, Adv. Space Res., 62, 191 [Google Scholar]
- Armitage, P. J. 2011, ARA&A, 49, 195 [Google Scholar]
- Balbus, S. A. 2000, ApJ, 534, 420 [CrossRef] [Google Scholar]
- Balbus, S. A. 2003, ARA&A, 41, 555 [Google Scholar]
- Becerra, R. L., De Colle, F., Watson, A. M., et al. 2019, ApJ, 887, 254 [NASA ADS] [CrossRef] [Google Scholar]
- Beloborodov, A. M., Stern, B. E., & Svensson, R. 1998, ApJ, 508, L25 [NASA ADS] [CrossRef] [Google Scholar]
- Beloborodov, A. M., Stern, B. E., & Svensson, R. 2000, ApJ, 535, 158 [NASA ADS] [CrossRef] [Google Scholar]
- Bhat, P., Briggs, M. S., Connaughton, V., et al. 2011, ApJ, 744, 141 [Google Scholar]
- Christodoulou, D. M., & Narayan, R. 1992, ApJ, 388, 451 [NASA ADS] [CrossRef] [Google Scholar]
- Chrzanowski, P. L. 1975, Phys. Rev. D, 11, 2042 [NASA ADS] [CrossRef] [Google Scholar]
- Cohen, J. M., & Kegeles, L. S. 1974, Phys. Rev. D, 10, 1070 [NASA ADS] [CrossRef] [Google Scholar]
- Coughlin, E. R., Nixon, C., Barnes, J., Metzger, B. D., & Margutti, R. 2020, ApJ, 896, L38 [NASA ADS] [CrossRef] [Google Scholar]
- Dall’Osso, S., Perna, R., Tanaka, T. L., & Margutti, R. 2017, MNRAS, 464, 4399 [CrossRef] [Google Scholar]
- Eichler, D., & Cheng, A. F. 1989, ApJ, 336, 360 [NASA ADS] [CrossRef] [Google Scholar]
- Gammie, C. F., McKinney, J. C., & Tóth, G. 2003, ApJ, 589, 444 [Google Scholar]
- Golkhou, V. Z., & Butler, N. R. 2014, ApJ, 787, 90 [NASA ADS] [CrossRef] [Google Scholar]
- Gottlieb, O., Lalakos, A., Bromberg, O., Liska, M., & Tchekhovskoy, A. 2022, MNRAS, 510, 4962 [CrossRef] [Google Scholar]
- Guidorzi, C., Dichiara, S., Frontera, F., et al. 2015, ApJ, 801, 57 [NASA ADS] [CrossRef] [Google Scholar]
- Hachisu, I., Tohline, J. E., & Eriguchi, Y. 1987, ApJ, 323, 592 [NASA ADS] [CrossRef] [Google Scholar]
- Harten, A., Lax, P. D., Leer, B. V., 1983, SIAM Rev., 25, 35 [CrossRef] [Google Scholar]
- Hjorth, J., Sollerman, J., Møller, P., et al. 2003, Nature, 423, 847 [Google Scholar]
- Hueckstaedt, R., Peterson, A., & Hunter, J., Jr 2005, MNRAS, 361, L35 [NASA ADS] [CrossRef] [Google Scholar]
- Hunter, J. H., Jr, Whitaker, R. W., & Lovelace, R. V. 1997, ApJ, 482, 852 [CrossRef] [Google Scholar]
- Hunter, J. H., Jr, Whitaker, R. W., & Lovelace, R. V. 1998, ApJ, 508, 680 [CrossRef] [Google Scholar]
- Janiuk, A. 2022a, in XL Polish Astronomical Society Meeting, 12, 221 [NASA ADS] [Google Scholar]
- Janiuk, A. 2022b, Black-hole Activity Feedback from Bondi-radius to Galaxy-cluster Scales, 2022, 29 [Google Scholar]
- Janiuk, A., & Proga, D. 2008, ApJ, 675, 519 [NASA ADS] [CrossRef] [Google Scholar]
- Janiuk, A., Yuan, Y., Perna, R., & Di Matteo, T. 2007, ApJ, 664, 1011 [NASA ADS] [CrossRef] [Google Scholar]
- Janiuk, A., Moderski, R., & Proga, D. 2008, ApJ, 687, 433 [NASA ADS] [CrossRef] [Google Scholar]
- Janiuk, A., Sukova, P., & Palit, I. 2018, ApJ, 868, 68 [NASA ADS] [CrossRef] [Google Scholar]
- Janka, H. T., Langanke, K., Marek, A., Martínez-Pinedo, G., & Müller, B. 2007, Phys. Rep., 442, 38 [NASA ADS] [CrossRef] [Google Scholar]
- Karas, V., Sapountzis, K., & Janiuk, A. 2020, ArXiv e-prints [arXiv:2012.15105] [Google Scholar]
- Katz, J. 1994, ApJ, 422, 248 [NASA ADS] [CrossRef] [Google Scholar]
- Kawanaka, N., & Kohri, K. 2012, MNRAS, 419, 713 [NASA ADS] [CrossRef] [Google Scholar]
- Kawanaka, N., Mineshige, S., & Piran, T. 2013, ApJ, 777, L15 [NASA ADS] [CrossRef] [Google Scholar]
- Kifonidis, K., Plewa, T., Janka, H.-T., & Müller, E. 2003, A&A, 408, 621 [NASA ADS] [CrossRef] [EDP Sciences] [Google Scholar]
- Komissarov, S. S. 1999, MNRAS, 308, 1069 [Google Scholar]
- Król, D. Ł., & Janiuk, A. 2021, ApJ, 912, 132 [CrossRef] [Google Scholar]
- Kumar, P., & Zhang, B. 2015, Phys. Rep., 561, 1 [Google Scholar]
- Lei, W., Wang, D., Zhang, L., et al. 2009, ApJ, 700, 1970 [NASA ADS] [CrossRef] [Google Scholar]
- Lodato, G. 2008, New A Rev., 52, 21 [Google Scholar]
- Margutti, R., Guidorzi, C., Chincarini, G., et al. 2010, MNRAS, 406, 2149 [NASA ADS] [CrossRef] [Google Scholar]
- Masada, Y., Kawanaka, N., Sano, T., & Shibata, K. 2007, ApJ, 663, 437 [NASA ADS] [CrossRef] [Google Scholar]
- Meszaros, P., & Ostriker, J. 1983, ApJ, 273, L59 [NASA ADS] [CrossRef] [Google Scholar]
- Murguia-Berthier, A., Batta, A., Janiuk, A., et al. 2020, ApJ, 901, L24 [NASA ADS] [CrossRef] [Google Scholar]
- Narayan, R., & Kumar, P. 2009, MNRAS, 394, L117 [NASA ADS] [CrossRef] [Google Scholar]
- Narayan, R., Paczynski, B., & Piran, T. 1992, ApJ, 395, L83 [NASA ADS] [CrossRef] [Google Scholar]
- Noble, S. C., Gammie, C. F., McKinney, J. C., & Del Zanna, L. 2006, ApJ, 641, 626 [NASA ADS] [CrossRef] [Google Scholar]
- Obergaulinger, M., Cerdá-Durán, P., Müller, E., & Aloy, M. A. 2009, A&A, 498, 241 [NASA ADS] [CrossRef] [EDP Sciences] [Google Scholar]
- Palit, I., Janiuk, A., & Sukova, P. 2019, MNRAS, 487, 755 [NASA ADS] [CrossRef] [Google Scholar]
- Perna, R., Armitage, P. J., & Zhang, B. 2006, ApJ, 636, L29 [NASA ADS] [CrossRef] [Google Scholar]
- Petit, V., Wade, G. A., Schneider, F. R. N., et al. 2019, MNRAS, 489, 5669 [NASA ADS] [CrossRef] [Google Scholar]
- Petropoulou, M., Beniamini, P., Vasilopoulos, G., Giannios, D., & Barniol Duran, R. 2020, MNRAS, 496, 2910 [NASA ADS] [CrossRef] [Google Scholar]
- Piran, T. 2004, Rev. Modern Phys., 76, 1143 [Google Scholar]
- Piran, T., Shemi, A., & Narayan, R. 1993, MNRAS, 263, 861 [NASA ADS] [Google Scholar]
- Podsiadlowski, P., Rappaport, S., & Han, Z. 2003, MNRAS, 341, 385 [NASA ADS] [CrossRef] [Google Scholar]
- Pontzen, A., Deason, A., Governato, F., et al. 2010, MNRAS, 402, 1523 [NASA ADS] [CrossRef] [Google Scholar]
- Reichert, M., Obergaulinger, M., Aloy, M. Á., et al. 2023, MNRAS, 518, 1557 [Google Scholar]
- Ryu, T., Krolik, J., Piran, T., & Noble, S. C. 2020, ApJ, 904, 99 [NASA ADS] [CrossRef] [Google Scholar]
- Shahamat, N., & Abbassi, S. 2020, ApJ, 888, 64 [NASA ADS] [CrossRef] [Google Scholar]
- Shahamat, N., Abbassi, S., & Liu, T. 2021, MNRAS, 508, 6068 [NASA ADS] [CrossRef] [Google Scholar]
- Shapiro, S. L., & Teukolsky, S. A. 1986, Black Holes, White Dwarfs and Neutron Stars: The Physics of Compact Objects [Google Scholar]
- Sironi, L., & Spitkovsky, A. 2011, ApJ, 741, 39 [Google Scholar]
- Spruit, H. C. 2002, A&A, 381, 923 [CrossRef] [EDP Sciences] [Google Scholar]
- Suková, P., & Janiuk, A. 2015, MNRAS, 447, 1565 [CrossRef] [Google Scholar]
- Suková, P., Charzyński, S., & Janiuk, A. 2017, MNRAS, 472, 4327 [CrossRef] [Google Scholar]
- Teukolsky, S. A. 1972, Phys. Rev. Lett., 29, 1114 [NASA ADS] [CrossRef] [Google Scholar]
- Toomre, A. 1964, ApJ, 139, 1217 [Google Scholar]
- van de Meent, M. 2017, Classical Quantum Gravity, 34 [Google Scholar]
- Wald, R. M. 1974, Phys. Rev. D, 10, 1680 [Google Scholar]
- Wald, R. M. 1978, Phys. Rev. Lett., 41, 203 [NASA ADS] [CrossRef] [Google Scholar]
- White, C. J., Burrows, A., Coleman, M. S. B., & Vartanyan, D. 2022, ApJ, 926, 111 [NASA ADS] [CrossRef] [Google Scholar]
- Woosley, S. E. 1993, ApJ, 405, 273 [Google Scholar]
- Woosley, S. E., & Bloom, J. S. 2006, ARA&A, 44, 507 [Google Scholar]
- Woosley, S. E., & Heger, A. 2006, ApJ, 637, 914 [CrossRef] [Google Scholar]
- Woosley, S. E., & Heger, A. 2015, ApJ, 810, 34 [NASA ADS] [CrossRef] [Google Scholar]
- Zhang, W., Woosley, S. E., & MacFadyen, A. I. 2003, ApJ, 586, 356 [CrossRef] [Google Scholar]
Appendix A: Model table
All models account for the Kerr metric update due to changing mass and spin of the black hole. Some models (SG) also have the option of self-gravity force acting on the matter due to the mass and angular momentum of the gas enclosed in the sphere. Most simulations were run until 50000 tg, but models marked with an asterisk were run until 30000 tg. Models names given in column 1 are used in the text and figure labels.
List of models calculated for an initial black hole of 3 M⊙, and an initial cloud mass of 25 M⊙.
All Tables
Square values of the RT and SGI growth rates for the self-gravitating case of S = 1.4 and A0 = 0.5 (model A05-S14-SG-R10).
List of models calculated for an initial black hole of 3 M⊙, and an initial cloud mass of 25 M⊙.
All Figures
|
Fig. 1. Schematic view of the collapsar at the onset of the GRB: stellar core (dark blue), stellar envelope composed of subsequent accreting shells with decreasing density (light blue-yellow-orange-green), and rotationally supported accretion disc formed at the equatorial region (red). The horizontal black line represents the equatorial plane. The circle marked with a stripped line represents an exemplary chosen radius above the horizon, at which the gas feels the perturbative force due to the self-gravity of the matter enclosed within this radius (see Eq. (7)). |
| In the text | |
|
Fig. 2. Evolution of the accretion rate and black hole parameters including and excluding self-gravity plotted by the thick and thin curves, respectively. The top panels refer to the initial black hole spin parameter A0 = 0.85 while the bottom panels correspond to A0 = 0.5. Three different values for the initial rotation parameter are also considered, i.e. S = 1, 1.4, and 2, shown with the blue, pink, and green curves. The left plots refer to the evolution of black hole mass, the middle plot shows the accretion rate temporal behavior, and the panels to the right demonstrate the evolution of the black hole spin parameter. Models are labelled in the middle panels with symbols referring to Table A.1. |
| In the text | |
|
Fig. 3. Time evolution of the black hole spin for the rotation normalised with specific angular momentum at ISCO S = 1.0 (left) and S = 2.0 (right). Thick lines represent self-gravitating models and thin lines show the case where self-gravity is neglected. Various initial black hole spin values are shown, as labelled in the plots and marked by dark green for a0 = 0.85, violet for a0 = 0.6, magenta for a0 = 0.5, and light green for a0 = 0.83. Models are labelled in both panels with symbols referring to Table A.1. |
| In the text | |
|
Fig. 4. Snapshots of density and pressure at different time steps for the self-gravitating model. The rotation parameter is S = 1.4 and initial black hole spin is A = 0.5. The top four profiles demonstrate the velocity vector field overlaid on the background of density profiles, with thick white curves as the contour plot of the sonic surface. The bottom snapshots show the pressure profiles and indicate how it varies through the inner regions, corresponding to density, which provides information on the SGI/RT instability. We note that the first and second snapshots (t = 0 and t = 0.089 s) show a larger area of about 100rg, while the other two time snapshots illustrate the zoomed-in profiles, in order to better visualise the shocked region. The model shown is A05-S14-SG-R10, as listed in Table A.1. |
| In the text | |
|
Fig. 5. Snapshots of density and pressure profiles similar to Fig. 4, for the model with rotation parameter S = 2 and initial black hole spin A0 = 0.5. The third snapshot (t = 0.665 s) is zoomed out to a larger area of about 1000rg, while the first two time snapshots illustrate a zoom onto 300rg for a clear representation of both outflow regions at the final time steps and improved visibility of inhomogeneities. The model shown is A05-S20-SG-R12, as listed in Table A.1. |
| In the text | |
|
Fig. 6. Specific angular momentum at the equator taken at several time steps corresponding to the inhomogeneous structure in the self-gravitating case (right panels in both rows). The cases without self-gravity are also presented in the left two panels. Two cases of S = 1.4 and S = 2 with A0 = 0.5 are shown in the top and bottom panels, respectively. During the emergence of inhomogeneities, self-gravity seems to transfer the angular momentum into the black hole. Models are labelled in all panels with symbols referring to Table A.1. |
| In the text | |
|
Fig. 7. Specific angular momentum snapshots, for the model with a self-gravitating collapsing stellar core with S = 1.4 and A0 = 0.5. In a time interval between the second and the fifth snapshot, an inhomogeneous structure in the inner region can be detected, indicating the effects of self-gravity. The model shown is A05-S14-SG-R10, as listed in Table A.1. |
| In the text | |
|
Fig. 8. Specific angular momentum snapshots for the model with a self-gravitating collapsing stellar core with S = 2 and A0 = 0.5. The inhomogeneities demonstrate self-gravity impacts, as seen in the second and third time snapshots. The model shown is A05-S20-SG-R12, as listed in Table A.1. |
| In the text | |
|
Fig. 9. Demonstration of how the condition for axisymetric modes (κ2/πGρ < 1) is satisfied at the equator in some time steps, considering both cases with (solid lines) and without (dashed inset curves) self-gravity. ‘Homo’ and ‘InHomo’ refer to homogeneous and inhomogeneous structures, respectively. We note the logarithmic scale on the vertical axis. Models are labelled in all panels with symbols referring to Table A.1. |
| In the text | |
|
Fig. 10. Density profiles at the time t = 0.118 s for three cases of S = 1, 1.4, and 2 related to the images at the top, middle, and bottom, respectively. These snapshots illustrate the density structure of the envelope when the ring-like gravitational instability becomes possible. However, the case with S = 2, i.e. the last profile, shows no axisymmetric growing mode. Models shown from top to bottom are A05-S10-SG-R12, A05-S14-SG-R10, and A05-S20-SG-R12, as listed in Table A.1. |
| In the text | |
|
Fig. 11. Time evolution of the black hole mass (left), accretion rate onto the event horizon (middle), and black hole spin (right) for the rotation normalised with specific angular momentum at ISCO S = 1.0 and S = 2.0 (models are labelled in the middle panel with symbols referring to Table A.1). The initial spin of the black hole was A0 = 0.85, and the initially vertical magnetic field given by Eq. (17) was normalised with β = 10 or β = 100 at the ISCO radius. |
| In the text | |
|
Fig. 12. Density profiles with the contours of the magnetic field vector potential at the final stage of the simulations. The first row presents simulations with no self-gravity and either no magnetic field (left panel), β = 100 (middle panel), or β = 10 (right panel). The second row presents simulations with self-gravity and either no magnetic field (left panel), β = 100 (middle panel), or β = 10 (right panel). The simulations assume a vertical magnetic field configuration. Parameters: A0 = 0.3, S = 1.0. The models shown are A03-S10-nSG-R12, A03-S10-nSG-wMF, and A03-S10-nSG-sMF (top row), and A03-S10-SG-R12, A03-S10-SG-wMF, and A03-S10-SG-sMF (bottom row), as listed in Table A.1. |
| In the text | |
|
Fig. 13. Distribution of density and magnetic field vector potential contours at t = 0 (left), and the short-time evolved snapshots taken at time t = 0.148 s (middle), and at the end of simulation time t = 0.739 s (right). The magnetic field of dipole configuration is adopted and normalised with β = 50. Top row is scaled to the outer radius of the domain, at 1000rg, and bottom row is zoomed in to 100rg. Simulation was done in an evolving Kerr metric, but without the self-gravity effect. Parameters: A0 = 0.85, S = 1.0. The model shown is D08-S10-nSG-b50, as listed in Table A.1. |
| In the text | |
|
Fig. 14. As in Fig. 13 but with the self-gravity effect. The model shown is D08-S10-SG-b50, as listed in Table A.1. |
| In the text | |
|
Fig. 15. Distribution of density and magnetic field vector potential contours at t = 0 (left), and the short-time evolved snapshots taken at time t = 0.148 s (middle), and at the end of the simulation at t = 0.296 s (right). The magnetic field of the dipole configuration is adopted and normalised with β = 50. The top row is scaled to the outer radius of the domain, at 1000rg, and the bottom row is zoomed in to 100rg. The simulation was done in an evolving Kerr metric, but without the self-gravity effect. Parameters: A0 = 0.85, S = 1.0. The model shown is W08-S10-nSG-b50, as listed in Table A.1. |
| In the text | |
|
Fig. 16. As in Fig. 15 but with self-gravity effect. Model shown is W08-S10-SG-b50, as listed in Table A.1. |
| In the text | |
|
Fig. 17. Time evolution of the magnetic flux at the black hole horizon normalised to the mass flux (see Eq. (23)). Models are normalised with specific angular momentum at ISCO S = 1.0 and S = 2.0 (as labelled in the panels). The initial spin of the black hole is A0 = 0.85. The initial magnetic field is dipole, given by Eq. (19), and normalised with maximum magnetisation of σ = 1 or σ = 0.1 (left panel), or is a vertical field, given by Eq. (18), and normalised with gas-to-magnetic pressure ratio at ISCO equal to β = 50. Models are labelled in both panels with symbols referring to Table A.1. |
| In the text | |
|
Fig. 18. Density plots showing the difference of Afinal (left panels), Amax (middle panels) and MBH (right panels) between SG and nSG models for simulations without magnetic field (upper row), with magnetic field normalised to β = 100 (middle row) and for β = 10 (lower row). |
| In the text | |
|
Fig. 19. Radial profiles of Mach number and density at some specific time snapshots, or models with S = 2 and A0 = 0.5. The left panels show the curves in the self-gravitating case, while the plots in the right panels show the curves in the self-gravitating magnetised case. For the sake of increased visibility, we provide zoomed-in inset panels representing the inner regions. Models are labelled in the all panels with symbols referring to Table A.1. |
| In the text | |
Current usage metrics show cumulative count of Article Views (full-text article views including HTML views, PDF and ePub downloads, according to the available data) and Abstracts Views on Vision4Press platform.
Data correspond to usage on the plateform after 2015. The current usage metrics is available 48-96 hours after online publication and is updated daily on week days.
Initial download of the metrics may take a while.