Open Access
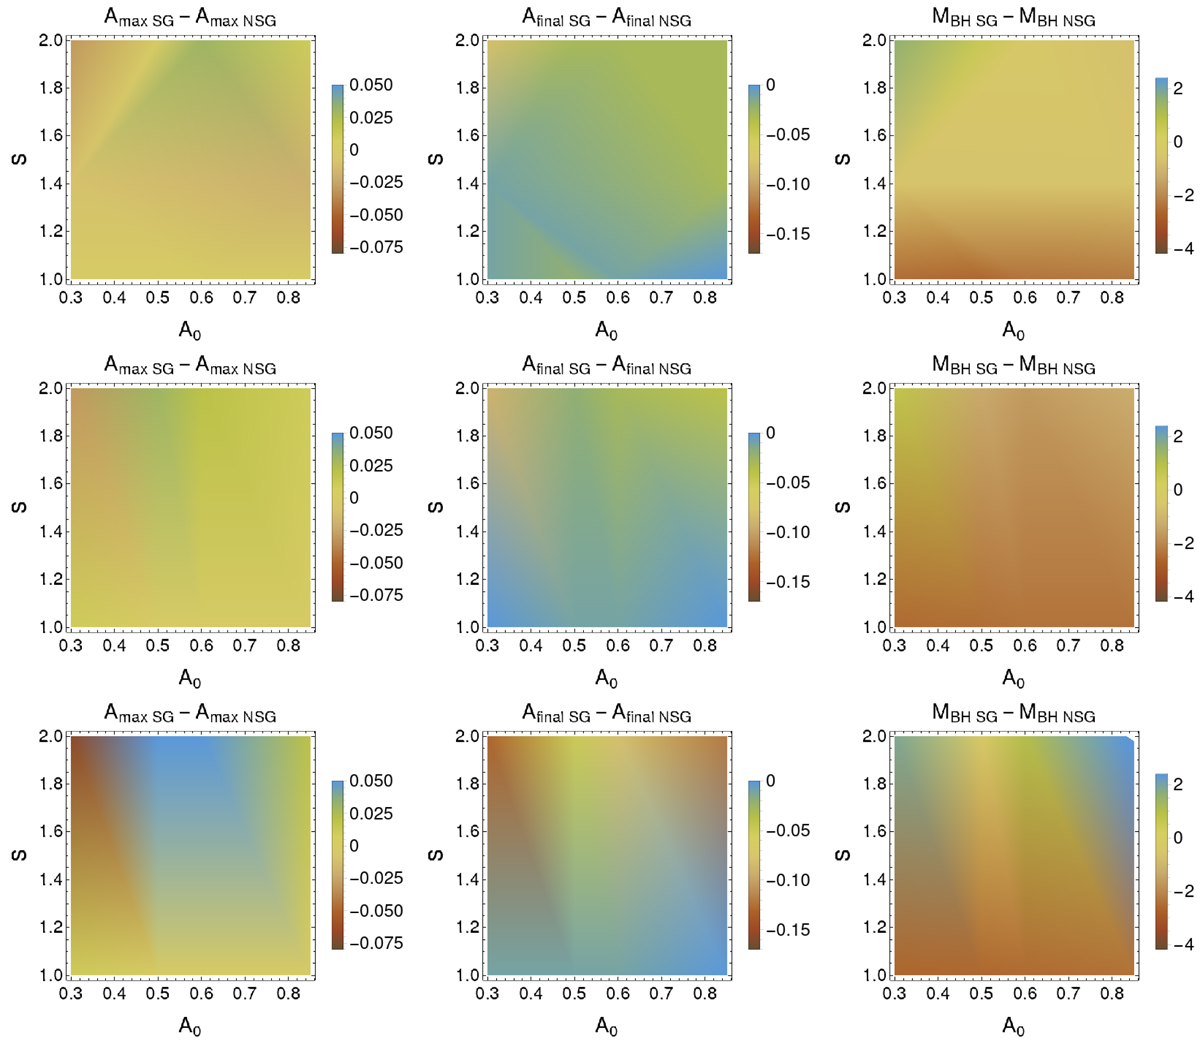
Fig. 18.
Download original image
Density plots showing the difference of Afinal (left panels), Amax (middle panels) and MBH (right panels) between SG and nSG models for simulations without magnetic field (upper row), with magnetic field normalised to β = 100 (middle row) and for β = 10 (lower row).
Current usage metrics show cumulative count of Article Views (full-text article views including HTML views, PDF and ePub downloads, according to the available data) and Abstracts Views on Vision4Press platform.
Data correspond to usage on the plateform after 2015. The current usage metrics is available 48-96 hours after online publication and is updated daily on week days.
Initial download of the metrics may take a while.