Fig. 4.
Download original image
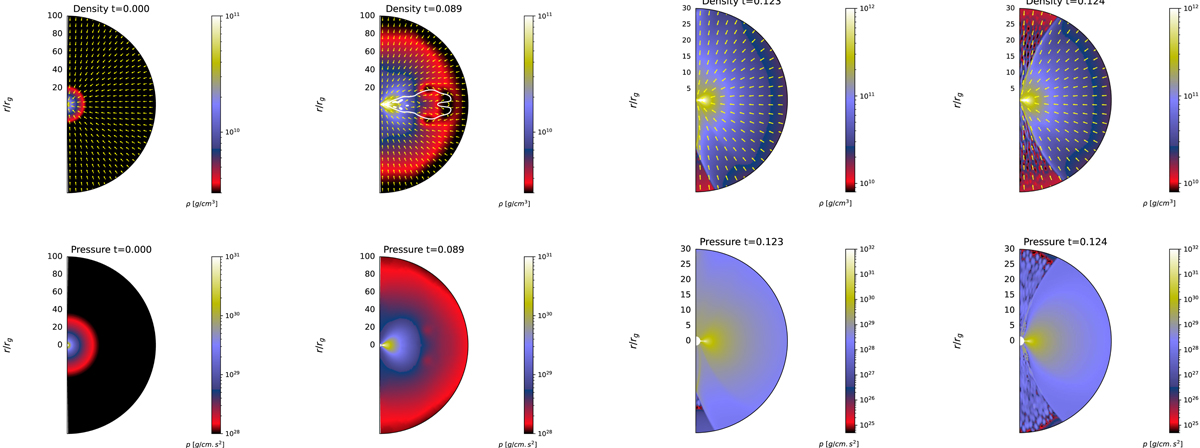
Snapshots of density and pressure at different time steps for the self-gravitating model. The rotation parameter is S = 1.4 and initial black hole spin is A = 0.5. The top four profiles demonstrate the velocity vector field overlaid on the background of density profiles, with thick white curves as the contour plot of the sonic surface. The bottom snapshots show the pressure profiles and indicate how it varies through the inner regions, corresponding to density, which provides information on the SGI/RT instability. We note that the first and second snapshots (t = 0 and t = 0.089 s) show a larger area of about 100rg, while the other two time snapshots illustrate the zoomed-in profiles, in order to better visualise the shocked region. The model shown is A05-S14-SG-R10, as listed in Table A.1.
Current usage metrics show cumulative count of Article Views (full-text article views including HTML views, PDF and ePub downloads, according to the available data) and Abstracts Views on Vision4Press platform.
Data correspond to usage on the plateform after 2015. The current usage metrics is available 48-96 hours after online publication and is updated daily on week days.
Initial download of the metrics may take a while.