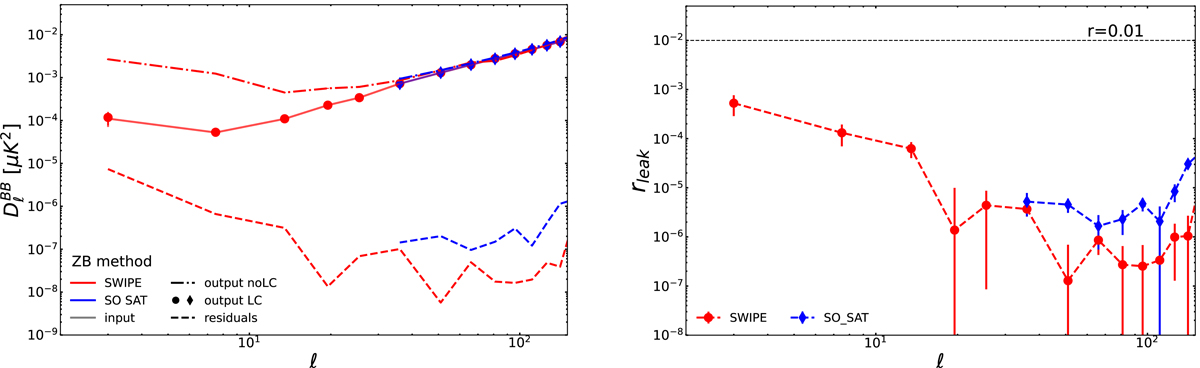
Fig. 8.
Download original image
B-mode CMB power spectrum reconstruction after the E–B leakage correction with the application of the ZB method. On the left: Mean angular power spectrum over 200 CMB-only simulations including lensing and a primordial tensor signal with r = 0.01. Solid lines represent the power of exact B-maps reconstructed with full-sky EB-decomposition of Q and U; circles and diamonds that of leakage-corrected maps (output LC) with the ZB method; the dashed lines the leakage residuals after the correction; the dashed-dotted lines the CMB B modes without any leakage correction (output noLC). The LSPE-SWIPE (red) and SO-SAT (blue) footprints have been considered. On the right: Effective tensor-to-scalar ratio associated with the absolute difference between leakage-corrected and exact angular power spectra is shown for SWIPE (red) and SO-SAT (blue). A binning scheme of Δℓ = 3 for ℓ ≤ 4, Δℓ = 6 for 5 ≤ ℓ ≤ 28, and Δℓ = 15 for ℓ ≥ 29 is employed for the spectra computed in the LSPE-SWIPE patch, while a constant Δℓ = 15 for those estimated in the SO footprint. The error-bars highlight the uncertainty on the mean at 1σ. Readers can refer to the main text for details.
Current usage metrics show cumulative count of Article Views (full-text article views including HTML views, PDF and ePub downloads, according to the available data) and Abstracts Views on Vision4Press platform.
Data correspond to usage on the plateform after 2015. The current usage metrics is available 48-96 hours after online publication and is updated daily on week days.
Initial download of the metrics may take a while.