Fig. 6.
Download original image
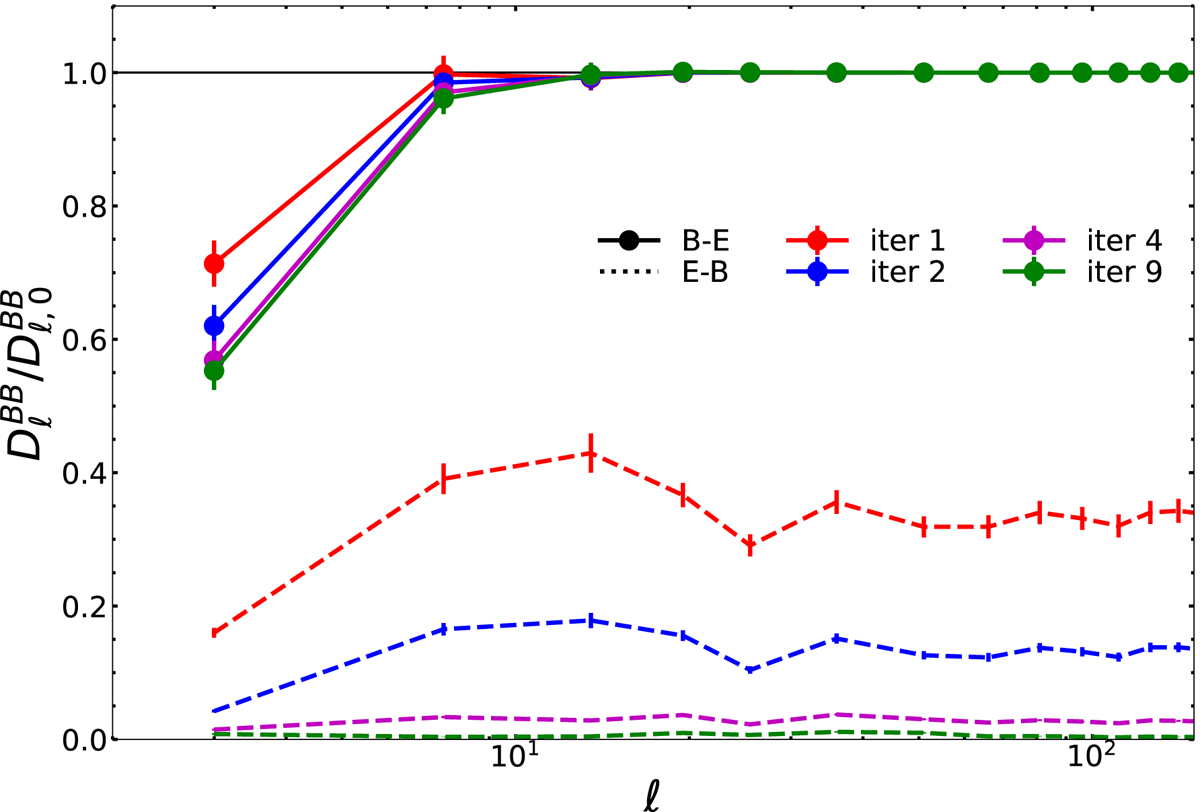
LSPE-SWIPE only. Ratio between the mean angular power spectrum of either pure B modes only (solid lines) or E–B leakage residuals (dashed lines) after having applied the iterative B decomposition correction and that of corresponding input maps. The cases with 1 (red), 2 (blue), 4 (magenta), and 9 (green) iterations are shown. 200 different realisations of CMB have been considered, including lensing and a primordial tensor signal with r = 0.01. The trend of dashed lines highlights the reduction of E–B leakage residuals obtained by performing the iterations. The trend of solid lines, instead, the loss of power suffered due to the B–E leakage when applying the iterative B decomposition. A binning scheme of Δℓ = 3 for ℓ ≤ 4, Δℓ = 6 for 5 ≤ ℓ ≤ 28, and Δℓ = 15 for ℓ ≥ 29 is employed. The error-bars highlight the uncertainty on the mean at 1σ, estimated from the dispersion of the angular power spectra of the simulations divided by ![]() . Readers can refer to the main text for details.
. Readers can refer to the main text for details.
Current usage metrics show cumulative count of Article Views (full-text article views including HTML views, PDF and ePub downloads, according to the available data) and Abstracts Views on Vision4Press platform.
Data correspond to usage on the plateform after 2015. The current usage metrics is available 48-96 hours after online publication and is updated daily on week days.
Initial download of the metrics may take a while.