Fig. A.1.
Download original image
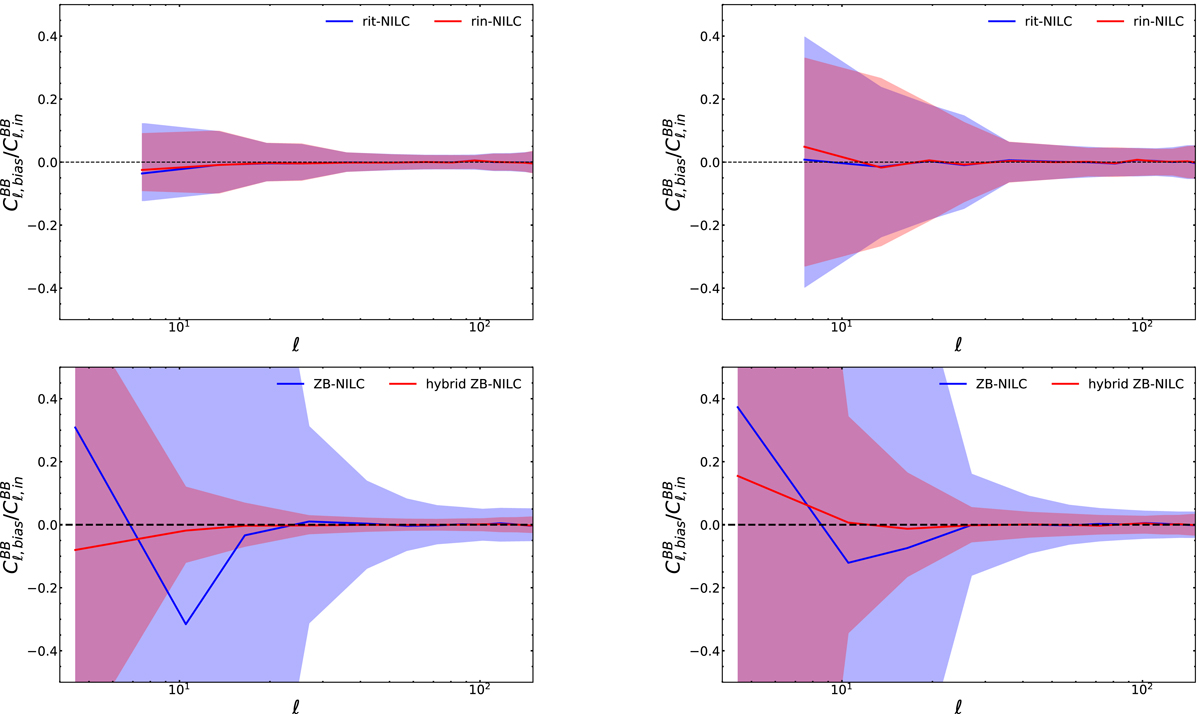
Bias in the CMB B-mode power spectrum reconstruction for SWIPE+Planck dataset. The ratio between the bias ![]() (see Eq. A.3) and the input CMB power spectrum
(see Eq. A.3) and the input CMB power spectrum ![]() . All angular power spectra were computed as the average among 200 different simulated NILC CMB reconstructions and adopting the masks employed in Sect. 5. The shaded regions display the relative uncertainty computed as
. All angular power spectra were computed as the average among 200 different simulated NILC CMB reconstructions and adopting the masks employed in Sect. 5. The shaded regions display the relative uncertainty computed as ![]() , where Nsims is the number of simulations. Top: Results of the application of rit-NILC (blue) and rin-NILC (red). Bottom: Bias from ZB (blue) and hybrid ZB-NILC (red). The Galactic emission was simulated with the d0s0 (left) and the d1s1 (right) sky models.
, where Nsims is the number of simulations. Top: Results of the application of rit-NILC (blue) and rin-NILC (red). Bottom: Bias from ZB (blue) and hybrid ZB-NILC (red). The Galactic emission was simulated with the d0s0 (left) and the d1s1 (right) sky models.
Current usage metrics show cumulative count of Article Views (full-text article views including HTML views, PDF and ePub downloads, according to the available data) and Abstracts Views on Vision4Press platform.
Data correspond to usage on the plateform after 2015. The current usage metrics is available 48-96 hours after online publication and is updated daily on week days.
Initial download of the metrics may take a while.