Fig. 10.
Download original image
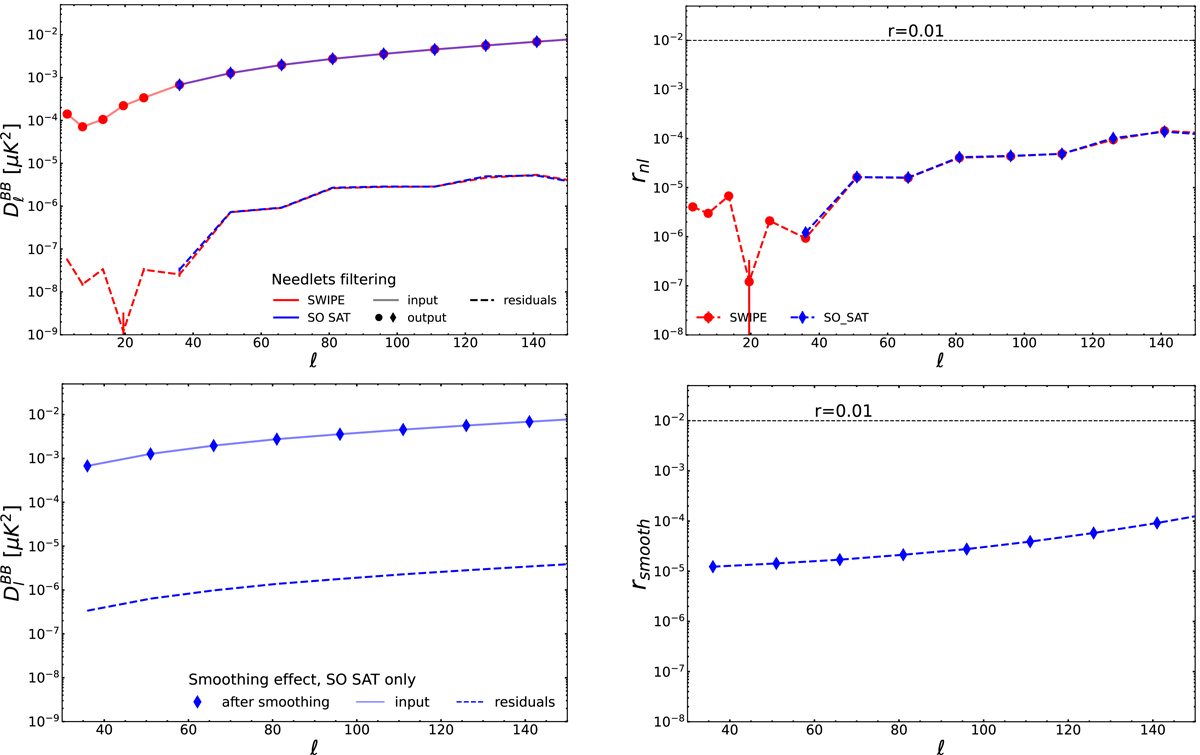
Goodness of the reconstruction of the CMB B-mode signal (lensing+r = 0.01) after needlet filtering (top) in the SWIPE (red) and SO (blue) patches or after smoothing CMB maps with input angular resolution of FWHM = 9′ to bring them to FWHM = 91′ in the SO footprint (bottom). On the left: Mean angular power spectra (over 200 CMB-only simulations) of the input exact B maps reconstructed with a full-sky EB-decomposition of Q and U (solid lines); those of the reconstructed maps after needlet filtering or beam convolution (dots and diamonds); and the corresponding residuals (dashed lines). The plot on the right represents the effective tensor-to-scalar ratios associated with the absolute differences between output power spectra after needlet filtering and beam convolution and exact input ones in the SWIPE (red) and SO (blue) patches. A binning scheme of Δℓ = 3 for ℓ ≤ 4, Δℓ = 6 for 5 ≤ ℓ ≤ 28, and Δℓ = 15 for ℓ ≥ 29 is employed for the spectra computed in the LSPE-SWIPE patch, while a constant Δℓ = 15 for those estimated in the SO footprint. The error-bars highlight the uncertainty on the mean of the simulations at 1σ.
Current usage metrics show cumulative count of Article Views (full-text article views including HTML views, PDF and ePub downloads, according to the available data) and Abstracts Views on Vision4Press platform.
Data correspond to usage on the plateform after 2015. The current usage metrics is available 48-96 hours after online publication and is updated daily on week days.
Initial download of the metrics may take a while.