Fig. 3.
Download original image
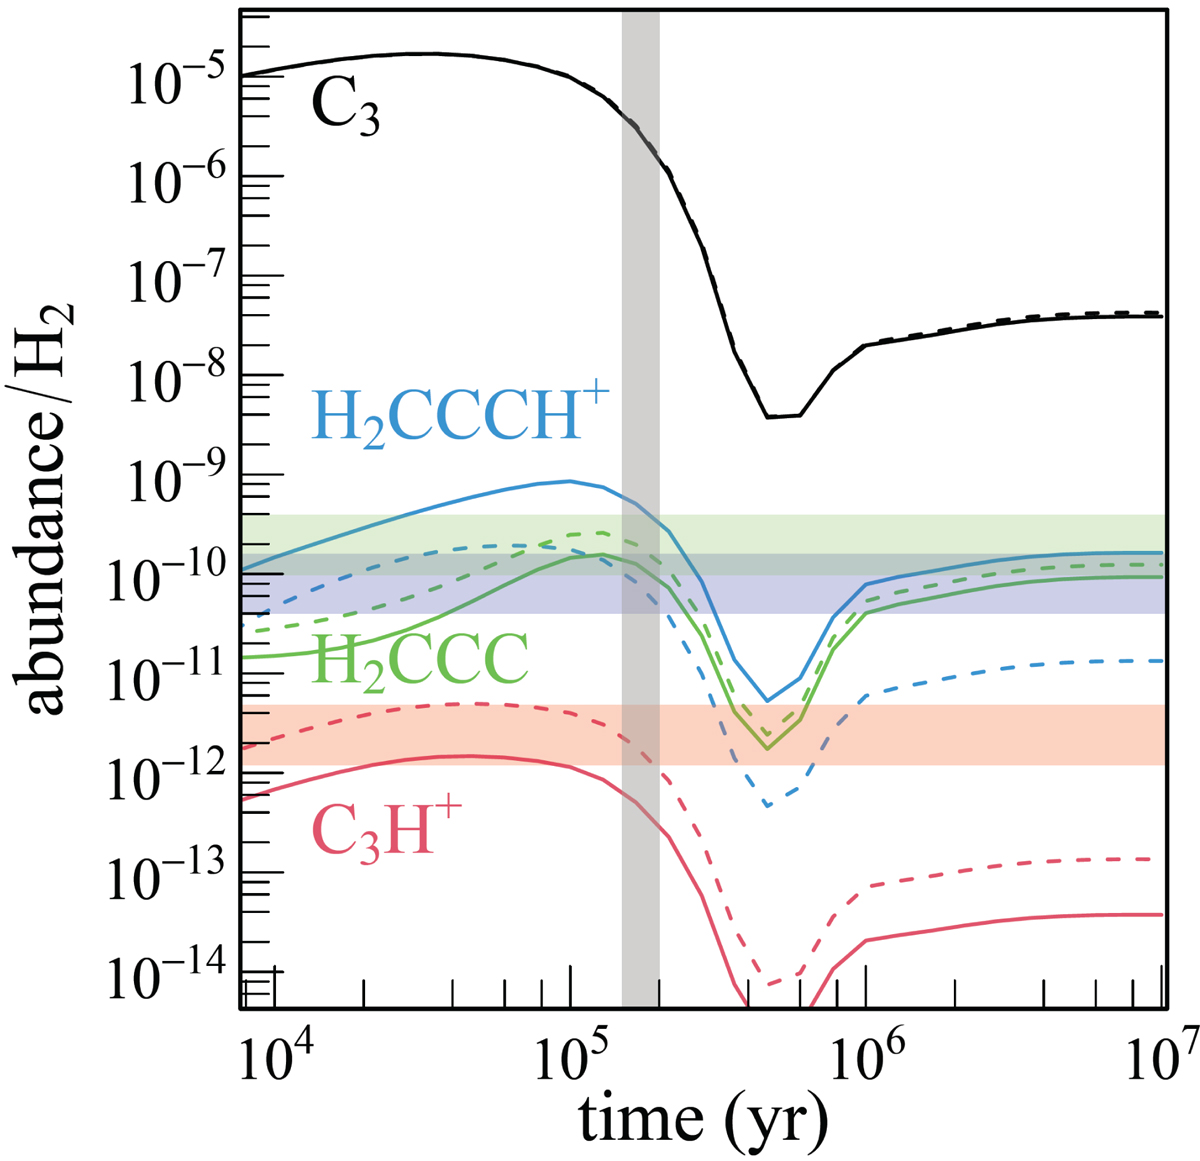
Abundances of C3, C3H+, H2CCC, and H2CCCH+ as a function of time predicted by our model (continuous lines). The horizontal colored areas represent the observations in TMC-1 assuming an uncertainty of 3 on the measurements (Cernicharo et al. 2022 for C3H+ and this work for H2CCCH+). Dashed lines: Same, but with a threefold decrease in the H2 + C3H+ and a fivefold increase in the H2CCCH+ + e− rate coefficients. The vertical gray area represents the values given by the most probable chemical age for TMC-1, due to the better agreement between calculations and observations for 67 key species.
Current usage metrics show cumulative count of Article Views (full-text article views including HTML views, PDF and ePub downloads, according to the available data) and Abstracts Views on Vision4Press platform.
Data correspond to usage on the plateform after 2015. The current usage metrics is available 48-96 hours after online publication and is updated daily on week days.
Initial download of the metrics may take a while.