| Issue |
A&A
Volume 690, October 2024
|
|
|---|---|---|
| Article Number | L13 | |
| Number of page(s) | 19 | |
| Section | Letters to the Editor | |
| DOI | https://doi.org/10.1051/0004-6361/202452196 | |
| Published online | 18 October 2024 | |
Letter to the Editor
Discovery of two cyano derivatives of acenaphthylene (C12H8) in TMC-1 with the QUIJOTE line survey⋆⋆
1
Dept. de Astrofísica Molecular, Instituto de Física Fundamental (IFF-CSIC), C/ Serrano 121, 28006
Madrid, Spain
2
Centro de Desarrollos Tecnológicos, Observatorio de Yebes (IGN), 19141 Yebes, Guadalajara, Spain
3
Observatorio Astronómico Nacional (OAN, IGN), C/ Alfonso XII, 3, 28014
Madrid, Spain
4
Centro Singular de Investigación en Química Biolóxica e Materiais Moleculares (CiQUS) and Departamento de Química Orgánica, Universidade de Santiago de Compostela, 15782
Santiago de Compostela, Spain
5
Departamento de Química Física y Química Inorgánica, Facultad de Ciencias-I.U. CINQUIMA, Universidad de Valladolid, 47011
Valladolid, Spain
6
Department of Chemistry, University of Hawaii at Manoa, Honolulu, HI, 96822
USA
7
Department of Applied Chemistry, Science Building II, National Yang Ming Chiao Tung University, 1001 Ta-Hsueh Rd., Hsinchu, 300098
Taiwan
Received:
10
September
2024
Accepted:
18
September
2024
Abstract
We report the discovery in TMC-1 of two cyano derivatives of the PAH acenaphthylene (C12H8). We have found two series of lines with the QUIJOTE line survey that we assign to 1-C12H7CN and 5-C12H7CN. For the 1-isomer, we have detected and assigned 173 rotational transitions with J up to 46 and Ka up to 9, corresponding to 107 independent frequencies. For the 5-isomer, the identification is based on 56 individual lines, corresponding to 117 rotational transitions with J up to 40 and Ka up to 8. Identification of the carriers was achieved through a careful analysis of the derived rotational constants, which permit us to focus on molecules larger than naphthalene but smaller than anthracene and phenanthrene. Moreover, the derived rotational constants indicate that the species are planar; this allows us to discard derivatives of fluorene and acenaphthene, which are non-planar species. Quantum chemical calculations and subsequent chemical synthesis of these molecules, as well as the observation of their rotational transitions in the laboratory, unequivocally support our identifications. We also confirm, via a robust line-by-line detection, the previous claimed detection of 1- and 2-cyanonaphthalene, which were obtained through statistical stacking techniques. The column densities of 1- and 5-cyanoacenaphthylene are (9.5 ± 0.9) × 1011 cm−2, while those of 1- and 2-cyanonapthalene are (5.5 ± 0.5) × 1011 cm−2. Hence, it seems that acenaphthylene could be a factor of 1.7 more abundant than naphthalene. These results support a scenario in which PAHs grow in cold dark clouds based on fused five- and six-membered carbon rings.
Key words: astrochemistry / line: identification / molecular data / ISM: molecules / ISM: individual objects: TMC-1
Based on observations carried out with the Yebes 40 m telescope (projects 19A003, 20A014, 20D023, 21A011, 21D005, and 23A024). The 40 m radio telescope at Yebes Observatory is operated by the Spanish Geographic Institute (IGN, Ministerio de Transportes, Movilidad y Agenda Urbana).
Corresponding author; This email address is being protected from spambots. You need JavaScript enabled to view it.
© The Authors 2024
 Open Access article, published by EDP Sciences, under the terms of the Creative Commons Attribution License (https://creativecommons.org/licenses/by/4.0), which permits unrestricted use, distribution, and reproduction in any medium, provided the original work is properly cited.
This article is published in open access under the Subscribe to Open model. This email address is being protected from spambots. You need JavaScript enabled to view it. to support open access publication.
1. Introduction
The QUIJOTE1 ultrasensitive line survey (Cernicharo et al. 2021a) has provided the detection of more than 60 molecular species in the last four years. Some of them are very polar molecules with relatively low abundances such as the 16 S-bearing species discovered in TMC-1 (Cernicharo et al. 2024), the radicals H2C3N and H2C4N (Cabezas et al. 2021, 2023), and the double-cyanide derivatives of methane (NCCH2CN) and ethylene (NCCHCHCN) (Agúndez et al. 2024). Nevertheless, one of the most significant results of QUIJOTE is the discovery, through the standard method of line-by-line detection, of low-dipole but very abundant pure hydrocarbons, such as CH2CHCCH (Cernicharo et al. 2021b), o-C6H4 (Cernicharo et al. 2021a), CH2CCHCCH (Cernicharo et al. 2021c), c-C5H6, and c-C9H8 (cyclopentadiene and indene; Cernicharo et al. 2021d), the radical H2CCCH (Agúndez et al. 2021, 2022), the long carbon chain CH2CCHC4H (Fuentetaja et al. 2022), and fulvenallene (c-C5H4CCH2; Cernicharo et al. 2022). These neutrals, together with some cations, such as l-C3H3+ (Silva et al. 2023), certainly play an important role in the growth of larger hydrocarbons and PAHs in TMC-1 (Cernicharo et al. 2022).
Indene is the only polycyclic aromatic hydrocarbon (PAH) discovered directly from its rotational spectrum (Cernicharo et al. 2021d). However, the cyano derivatives of benzene and naphthalene have been reported in TMC-1 using stacking techniques with the GOTHAM line survey (McGuire et al. 2018, 2021). It is not clear yet how these PAHs are formed in a cold dark cloud. It is unlikely that these molecules arise from a reservoir of PAHs existing since the early stages of the cloud, because these relatively small PAHs would not have survived the diffuse cloud stage. Moreover, the spatial distribution of benzonitrile is identical to that of cyanopolyynes and other molecular species (Cernicharo et al. 2023a). Hence, the observational evidence points towards a bottom-up formation process for these species in TMC-1. The chemical ingredients that form PAHs are the carbon chains, radicals, and cations that have been detected with QUIJOTE and mentioned above. However, the detailed chemical routes for the growth of PAHs are only beginning to emerge (Kaiser & Hansen 2021; Cernicharo et al. 2022). Taking into account the large abundances of indene and those inferred for benzene and naphthalene from their cyanide derivatives, it is clear that just a few reactions are involved in their production. Unfortunately, these reactions are still missing in our chemical networks. Consequently, it is highly important to detect more PAHs in order to provide additional clues as to their chemistry.
In this work, we present the discovery from the QUIJOTE data of two cyano derivatives of acenaphthylene (c-C12H8), which is composed of three fused carbon rings (two six-membered and one five-membered). We also confirm the previous identification of cyanonaphthalenes (McGuire et al. 2021) through a robust line-by-line detection. The derived abundances indicate that cyanoacenaphthylenes are ∼1.7 more abundant than cyanonaphthalenes. This result suggests that bigger PAHs in TMC-1 probably consist of a mixture of fused five- and six-membered carbon rings. We discuss possible formation routes for these molecules in cold clouds, such as TMC-1.
2. Observations
The observational data presented in this work are part of the QUIJOTE spectral line survey (Cernicharo et al. 2021a) in the Q-band towards TMC-1(CP) (αJ2000 = 4h41m41.9s and δJ2000 = +25 ° 41′27.0″), which was performed at the Yebes 40m radio telescope. This survey was carried out using a receiver built within the Nanocosmos project2 consisting of two cooled high-electron-mobility-transistor (HEMT) amplifiers covering the 31.0–50.3 GHz band with horizontal and vertical polarization. Fast Fourier transform spectrometers (FFTSs) with 8 × 2.5 GHz and a spectral resolution of 38.15 kHz provide the whole coverage of the Q-band in both polarizations. Receiver temperatures are 16 K at 32 GHz and 30 K at 50 GHz. The experimental setup is described in detail by Tercero et al. (2021).
All observations were performed using frequency-switching observing mode with a frequency throw of 10 and 8 MHz. The total observing time on the source for data taken with frequency throws of 10 MHz and 8 MHz is 465 and 737 hours, respectively. Hence, the total observing time on source is 1202 hours. The QUIJOTE sensitivity varies between 0.08 mK at 32 GHz and 0.2 mK at 49.5 GHz. A detailed description of the line survey and the data-analysis procedure are provided in Cernicharo et al. (2021a); Cernicharo et al. (2022). The main beam efficiency can be given across the Q band as Beff = 0.797 exp[−(ν(GHz)/71.1)2]. The forward telescope efficiency is 0.97. The telescope beam size at half power intensity is 54.4″ at 32.4 GHz and 36.4″ at 48.4 GHz. The absolute calibration uncertainty is 10%. The data were analysed with the GILDAS package3.
3. Results
Line identification in this work was performed using the MADEX code (Cernicharo 2012), in conjunction with the CDMS and JPL catalogues (Müller et al. 2005; Pickett et al. 1998). The intensity scale used in this study is the antenna temperature (TA*). Consequently, the telescope parameters and source properties were used when modelling the emission of the different species in order to produce synthetic spectra on this temperature scale. In this work, we assumed a velocity for the source relative to the local standard at rest of 5.83 km s−1 (Cernicharo et al. 2020). The source was assumed to be circular with a uniform brightness temperature and a radius of 40″ (Fossé et al. 2001).
3.1. A peculiar way to search for PAHs
We would like to start by introducing the method we used to search for new PAHs. Although seemingly disconnected, the story deserves to be told. When we detected the anion C7N− (Cernicharo et al. 2023b), we searched intensively for C7N. Quantum chemical calculations by Botschwina et al. (1999) predicted an electronic ground state 2Π with a moderate dipole moment of 1 D. However, due to the possible admixing of the ground state with a low-lying 2Σ state, which has a dipole moment of ∼3.6 D (Botschwina et al. 1999), the true value of the dipole moment could be between those of the two states, and in this case it could be detectable with our QUIJOTE data. The rotational constant of C7N is predicted to be ∼585 MHz. If the electronic ground state is 2Π, then the quantum numbers should be half integers. Our automatic programs to search for harmonic relations indicate 12 lines in very good harmonic relation with J half integers and Beff = 580.987 MHz and Deff = 4.94 Hz. Hereafter, we refer to these half-integer quantum numbers as J*. This was a very exciting result, pointing towards the presence of C7N in TMC-1. However, all these harmonically related lines could be easily identified with the MADEX catalogue with Ka = 0, 1, Ju = J* − 1/2 transitions of 1-cyanonaphthalene (see Table A.1). These lines are shown in Fig. A.1, which is based on a modified Loomis-Wood diagram (Loomis & Wood 1928). Details of the confirmation of cyanonaphthalenes and of the harmonic relation with J half integers for a- and b-type Ka = 0, 1 transitions are given in Appendix A.
We verified that this peculiarity of the Ka = 0, 1 lines also applies – with some variations due to the value of the rotational constants and to the values of the dipole moment components – to many other PAHs such as indene, fluorene, cyanoantracene, and cyanophenantrene among others. For any oblate asymmetric rotor, pairing of lines will occur for high-J; first for Kc = J, and then for Kc = J-1 and so on, and the effective B will approach C. A detailed analysis of the asymptotic behaviour of the energy levels of an asymmetric rotor is provided by Watson (2007). Consequently, visual inspection of the data following the method described in Appendix A allows us to easily detect the rotational transitions of heavy PAHs.
3.2. The series of lines B429 and B444
We searched using automatic and/or visual procedures for series of lines in harmonic relation with integer or half-integer quantum numbers. Once the series were found, we used the method described in the previous section and in Appendix A to visually explore the QUIJOTE data, searching for spectral patterns similar to those of 1- and 2-cyanonaphthalene. We discovered two series of lines harmonically related with half-integer quantum numbers. We quickly verified that these series could not be assigned to a species with quantum numbers 2 J* as all lines with even J would be missing. Hence, either we are detecting species in a 2Π state, or we are observing a similar case to that of 1- and 2-cyanonaphthalene.
The first series could be fitted with Beff = 429.0596 ±-pagination 0.0003 MHz and Deff = 1.81 ± 0.07 Hz, with J* from 73/2 to 93/2. The standard deviation of the fit is 11.6 kHz. Hereafter, we refer to this series of lines as B429. Using the same kind of modified Loomis-Wood plot described above, we found additional series of lines at slightly higher frequencies than those of B429. The first four series of lines, including those of B429, are shown in Fig. 1. To facilitate their visual identification, they are connected by blue straight lines, similarly to the visualization of 1-cyanonaphthalene shown in Fig. A.1. The lines connected by the first blue line (left one) correspond to upper quantum numbers Ju, Ka = 0, 1, and Kc = Ju, where Ju for each panel is J* − 1/2 (J* is indicated at the right side of the panels). These lines are those of B429 and are perfectly reproduced with the constants Beff and Deff derived above. The second blue line connects the transitions Ju − 1, Ka = 1, 2, and Kc = Ju − 2; it collapses to the first blue line for J* = 83/2 (Ju = 41). The third blue line connects the transitions Ju − 2, Ka = 2, 3, and Kc = Ju − 3. All transitions are ΔJ = +1. Many additional series of lines related to B429 were found in our data involving up to a total of 107 independent frequencies. The derived line parameters are given in Table B.1. It is clear that all these lines belong to the progressions of an asymmetric molecule with integer quantum numbers Ju = J* − 1/2 (Ju from 35 up to 46).
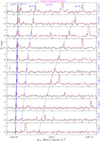 |
Fig. 1. Modified Loomis-Wood diagram of some of the observed lines of B429 (1-cyanoacenaphthylene). The abscissa corresponds to the value of the rotational constant, which has been fixed in this plot to values of between 429.040 and 429.160 MHz. The ordinate is the antenna temperature – corrected for atmospheric and telescope losses – in millikelvin. Each box presents the QUIJOTE data for frequencies 2 BrotJ*, where J* = Ju + 1/2. The red line corresponds to the synthetic spectrum computed for TMC-1, including the rotational transitions of all molecular species detected with QUIJOTE, adopting for them the physical parameters derived in all previous works. This spectrum contains the rotational lines of the two isomers of cyanoacenaphtylene discovered in this paper. The rotational transitions of 1-cyanoacenaphthylene correspond to those connected through blue lines (see text). The blue line on the left side corresponds to the Ka = 0, 1 transitions that are harmonically related with half-integer quantum numbers. |
In summary, the lines of B429 belong to Ka = 0, 1 (the set of transitions connected by the first blue line). The other lines have values of Ka varying from 1 up to 9. It was relatively easy to assign the quantum numbers to the 107 observed lines (corresponding to 173 rotational transitions) and to derive from these frequencies the rotational constants given in Table 1. We used an A-reduced Hamiltonian (representation Ir) and the derived rotational constants are given in Table 1. Similar to the case of 1- and 2-cyanonaphthalene, the rotational constant C derived differs from Beff by less than 0.002 MHz.
Molecular constants of the cyano isomers of acenaphthylene derived from QUIJOTE data (representation AIr).
The second series of lines in harmonic relation with half-integer quantum numbers is shown in Fig. 2. The lines are connected by a straight vertical blue line and can be reproduced with Beff = 444.298526 ± 0.00024 MHz and Deff = 2.848 ± 0.077 Hz, with J* between 71/2 and 85/2. Hereafter, we refer to the carrier of these lines as B444. Additional series of lines are shown in Fig. 2; these are also connected by blue lines that are assigned to Ka = 1, 2, and 3 lines of an asymmetric rotor, similarly to B429. The line parameters of all the observed lines are given in Table B.1. A total of 56 independent lines corresponding to 117 rotational transitions were assigned to B444. The rotational and distortion constants of B444 derived using an A-reduced Hamiltonian (representation Ir) are given in Table 1.
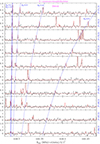 |
Fig. 2. Similar to Fig. 1 but for B444 (5-cyanoacenaphthylene). The range of Brot is from 444.274 to 444.474 MHz. |
For both carriers, the a- and b-type transitions have a significant collapse for Ka = 0, 1 and 1, 2. However, if the b component of the dipole moment is large, then we can expect to detect individual b-type transitions, as in the case of 1- and 2- cyanonaphthalene (see Fig. A.2). We searched for these b-type transitions for B429 and B444 without success, which indicates that the rotational spectrum is dominated by a-type transitions, that is, that μb is significantly lower than μa.
3.3. Quantum chemical calculations and identification of 1- and 5-cyanoacenaphthylene
In order to search for the carriers of B429 and B444, we compared the derived rotational constants with those of other asymmetric species to get some insights in their structure. The derived rotational constants for B429 and B444 could be compatible with cyano (or CCH) derivatives of anthracene, phenantrene, acenaphtene, fluorene, and acenapthylene, among other species with three fused rings.
We can discard derivatives of anthracene and phenanthrene as the rotational constants of these species, before any derivation, are smaller than those of B429 and B444 (Baba et al. 2009; Kowaka et al. 2012). To bolster our confidence in this conclusion, we performed quantum chemical calculations (see Appendix C) for all cyano derivatives of anthracene (see Table C.2) and phenanthrene (see Table C.3). None of these species, which are depicted in Figs. C.1 and C.2, can fit our rotational constants.
We can also discard non-planar molecules, as the derived C rotational constant for B429 and B444 is almost identical to (A × B)/(A + B), that is, the derived inertial defect is small or compatible with that of cyano derivatives of planar PAHs (see e.g. McNaughton et al. 2018). This allows us to discard cyano or ethylenic derivatives of indene, fluorene, and acenaphthene as possible carriers of our lines, as these species have large inertial defects due to the presence of one or two pairs of hydrogen atoms out of the plane of the molecule. Fluorene and acenaphthene have been observed in the laboratory by Thorwirth et al. (2007), and the cyano derivatives of fluorene have also been observed (Cabezas et al. 2024). Rotational constants for these species, together with values obtained from our quantum chemical calculations for CN derivatives of acenaphthene, are given in Tables C.4 and C.5. Indene derivatives have been studied in detail in the laboratory by Sita et al. (2022), and their rotational constants do not match those of B429 and B444. Doubly cyano derivatives of naphthalene, which are depicted in Fig. C.4, can also be discarded as carriers of our lines as their rotational constants are far from those of B429 and B444 (see Appendix C and Table C.6).
Finally, we consider the cyano derivatives of acenaphthylene (C12H8), a PAH that has been studied in the laboratory by Thorwirth et al. (2007) and that is planar (see central structure in Fig. 3). The rotational constants derived in the laboratory for this species are compared to those derived through our quantum chemical calculations in Table C.1. Four possible cyano derivatives can be obtained for this species. The structure of the mother molecule and of its CN derivatives is shown in Fig. 3. Hereafter, we refer to the CN derivatives of acenaphthylene as n-CNACY (n = 1, 3, 4 or 5). Our quantum chemical calculations indicate that 1-CNACY can be identified with B429 and that B444 can be assigned to 5-CNACY. The predicted rotational constants for the four isomers of CNACY (n-C12H7CN; n = 1, 3, 4, and 5) are given in Table 1.
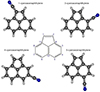 |
Fig. 3. Chemical structure of acenaphthylene (center design) and its cyano derivatives. The numbers label the nitrile substitution positions of the four possible isomers of cyanoacenaphthylene. The isomers detected in this work are 1-CNACY and 5-CNACY, which correspond to B429 and B444, respectively. |
In order to fully confirm the identification of B429 and B444 with 1-CNACY and 5-CNACY, we synthesized them in the chemical laboratory (see Appendix D) and observed their rotational spectrum in the microwave laboratory (see Appendix E). The resulting molecular parameters are given in Tables E.1 and E.2. The rotational constants derived in space for B429 agree with those of 1-CNACY (see Table E.1), and those of B444 are in perfect agreement with those of 5-CNACY (see Table E.2). Hence, we firmly conclude that we have detected, for the first time in space, two of the cyano derivatives of the PAH acenaphthylene. This is the fist time that a 3-fused carbon ring is detected in space. Moreover, these are the first PAHs that are fully characterised from astronomical data prior to any laboratory information on its rotational spectrum. These molecules contain 21 atoms and are, apart from the fullerenes, the largest species found in space. We find no evidence in our data for the 3-CNACY and 4-CNACY; moreover, they cannot be produced in the laboratory following the procedure described in Appendix D.
4. Discussion
In order to derive column densities for the two cyanide derivatives of acenaphthylene, we assumed that these species are close to thermalisation, Trot = 9 K, that molecular emission follows that of C6H5CN (Cernicharo et al. 2023a), and that it can be simplified, as in all our previous analyses, as a source of uniform brightness temperature of 80″ in diameter. With these assumptions, we derive the same column density of (9.5 ± 0.5) × 1011 cm−2 for 1-CNACY and 5-CNACY.
For 1- and 2-cyanonaphthalene we derive, adopting the same assumptions, a common column density of (5.5 ± 0.5) × 1011 cm−2. These values are a factor 1.4 times smaller than those derived by McGuire et al. (2021) for the same species. However, our identification of 1- and 2-cyanonaphthalene is based on many individual lines and a rotational temperature of 9 K, while those of McGuire et al. (2021) result from a stacking of spectral data and the assumption of four velocity components with different spatial sizes. We note that our extremely sensitive map of benzonitrile (Cernicharo et al. 2023a) does not support the spatial sizes derived from the stacking procedure. Any velocity component present in the stacked data of McGuire et al. (2021) should be present in our integrated intensity map, which indicates that benzonitrile has the same spatial distribution as many other species in TMC-1.
Assuming that the mother species, acenaphthylene and naphthalene, are ten times more abundant than their cyano derivatives, we could expect column densities for acenaphthylene (c-C12H8) and naphthalene (c-C10H8) of ∼1013 cm−2 and ∼5.5 × 1012 cm−2, respectively.
Acenaphthylene itself has a small permanent dipole moment (μb = 0.31 D) and has been observed in the laboratory (Thorwirth et al. 2007). Only a 3σ upper limit of N ≤ 3 × 1013 cm−2 can be obtained from the QUIJOTE. This result is in line with the abundance derived from its cyano derivatives. Acenaphthene (c-C12H10, μb = 0.9 D) and fluorene (c-C13H10, μb = 0.53 D) have also been observed by Thorwirth et al. (2007). Unfortunately, only upper limits of ∼(5–10) × 1012 cm−2 can be obtained for their column densities.
The estimated column density of acenaphthylene is larger than that of naphthalene by a factor of 1.7, which is similar to the column density ratio between indene and acenaphthylene, of namely N = (1.6 ± 0.3) × 1013 cm−2 (Cernicharo et al. 2021d). Hence, it seems that the growth of PAHs in TMC-1 favors the presence of PAH species containing fused five- and six-membered carbon rings. It is important to note in this context that the column density of cyclopentadiene is also significantly large, N = (1.2 ± 0.3) × 1013 cm−2 (Cernicharo et al. 2021d), which is of the order of the column density that can be estimated for benzene from benzonitrile (Cernicharo et al. 2022). Current chemical networks fail to explain the abundances of the simplest cycles, such as benzene and cyclopentadiene (Cernicharo et al. 2022). These latter authors examined formation routes to c-C5H6 involving cations and found that invoking the reaction between l-C3H3+ and C2H4 – which measurements suggest is rapid and was found to form the cation C5H7+ as a product (Smyth et al. 1982; Anicich 2003) – enabled production of the observed abundance of cyclopentadiene. That is, both neutral-neutral and ion-neutral reactions are likely to be at the origin of the growth of PAHs in cold clouds such as TMC-1. The formation of acenaphthylene itself could involve smaller rings, such as indene and naphthalene, as precursors. For example, the reaction of C2H with naphthalene or that of C3H with indene could directly produce acenaphthylene, although this possibility still has to be verified theoretically or/and experimentally (see Appendix F).
5. Data availability
Full Tables B.1, E.3 and E.4 are available at https://doi.org/10.5281/zenodo.13810127
Q-band Ultrasensitive Inspection Journey to the Obscure TMC-1 Environment.
Acknowledgments
We thank Spanish Ministerio de Ciencia e Innovación and the European Regional Development Fund (MICINN–ERDF) for funding support through projects PID2019-106110GB-I00, PID2019-106235GB-I00, PID2021-125015NB-I00, PID2022-139933NB-I00, and PID2023-147545NB-I00. We also thank ERC for funding through grant ERC-2013-Syg-610256-NANOCOSMOS. We thank the CSIC (Spain) for funding through project PIE 202250I097. The present study was also supported by Ministry of Science and Technology of Taiwan and CSIC under the MoST-CSIC Mobility Action 2021 (Grants 11-2927-I-A49-502 and OSTW200006).
References
- Agúndez, M., Cabezas, C., Tercero, B., et al. 2021, A&A, 647, L10 [EDP Sciences] [Google Scholar]
- Agúndez, M., Cabezas, C., Fuentetaja, R., et al. 2022, A&A, 657, A96 [NASA ADS] [CrossRef] [EDP Sciences] [Google Scholar]
- Agúndez, M., Bermúdez, C., Cabezas, C., et al. 2024, A&A, 688, L31 [NASA ADS] [CrossRef] [EDP Sciences] [Google Scholar]
- Anderson, G., & Anderson, G. 1955, J. Am. Chem. Soc., 77, 6610 [CrossRef] [Google Scholar]
- Anicich, V. G. 2003, JPL Publication, 03 [Google Scholar]
- Baba, M., Saitoh, M., Taguma, K., et al. 2009, J. Chem. Phys., 130, 134315 [NASA ADS] [CrossRef] [Google Scholar]
- Becke, A. D. 1993, J. Chem. Phys., 98, 1372 [Google Scholar]
- Botschwina, P., Horn, M., Markey, K., & Oswald, R. 1999, Mol. Phys., 92, 3 [Google Scholar]
- Broadus, M., & Kass, R. 2001, J. Am. Chem. Soc., 123, 4189 [CrossRef] [Google Scholar]
- Cabezas, C., Agúndez, M., Marcelino, N., et al. 2021, A&A, 654, L9 [NASA ADS] [CrossRef] [EDP Sciences] [Google Scholar]
- Cabezas, C., Tang, J., Agúndez, M., et al. 2023, A&A, 676, L5 [NASA ADS] [CrossRef] [EDP Sciences] [Google Scholar]
- Cabezas, C., Janeiro, J., Steber, A. L., et al. 2024, Phys. Chem. Chem. Phys., 26, 23703 [NASA ADS] [CrossRef] [Google Scholar]
- Cernicharo, J. 2012, EAS Publ. Ser., 58, 251 [Google Scholar]
- Cernicharo, J., Marcelino, N., Agúndez, M., et al. 2020, A&A, 642, L8 [NASA ADS] [CrossRef] [EDP Sciences] [Google Scholar]
- Cernicharo, J., Agúndez, M., Kaiser, R., et al. 2021a, A&A, 652, L9 [NASA ADS] [CrossRef] [EDP Sciences] [Google Scholar]
- Cernicharo, J., Agúndez, M., Cabezas, C., et al. 2021b, A&A, 647, L2 [EDP Sciences] [Google Scholar]
- Cernicharo, J., Cabezas, C., Agúndez, M., et al. 2021c, A&A, 647, L3 [EDP Sciences] [Google Scholar]
- Cernicharo, J., Agúndez, M., Cabezas, C., et al. 2021d, A&A, 649, L15 [EDP Sciences] [Google Scholar]
- Cernicharo, J., Fuentetaja, R., Agúndez, M., et al. 2022, A&A, 663, L9 [NASA ADS] [CrossRef] [EDP Sciences] [Google Scholar]
- Cernicharo, J., Tercero, B., Marcelino, N., et al. 2023a, A&A, 674, L4 [NASA ADS] [CrossRef] [EDP Sciences] [Google Scholar]
- Cernicharo, J., Pardo, J. R., Cabezas, C., et al. 2023b, A&A, 670, L19 [NASA ADS] [CrossRef] [EDP Sciences] [Google Scholar]
- Cernicharo, J., Cabezas, C., Agúndez, M., et al. 2024, A&A, 688, L13 [NASA ADS] [CrossRef] [EDP Sciences] [Google Scholar]
- Fossé, D., Cernicharo, J., Gerin, M., & Cox, P. 2001, ApJ, 552, 168 [Google Scholar]
- Frisch, M. J., Pople, J. A., & Binkley, J. S. 1984, J. Chem. Phys., 80, 3265 [Google Scholar]
- Frisch, M. J., Trucks, G. W., Schlegel, H. B., et al. 2016, Gaussian 16 Revision A.03 [Google Scholar]
- Fuentetaja, R., Cabezas, C., Agúndez, M., et al. 2022, A&A, 663, L3 [NASA ADS] [CrossRef] [EDP Sciences] [Google Scholar]
- Hahndorf, I., Lee, Y. T., Kaiser, R. I., et al. 2002, J. Chem. Phys., 116, 3248 [NASA ADS] [CrossRef] [Google Scholar]
- Jena, S., Dhanalakshmi, P., Bano, G., & Thilagar, P. 2020, J. Phys. Chem. B, 124, 5393 [CrossRef] [Google Scholar]
- Kaiser, R., & Hansen, N. 2021, J. Phys. Chem. A, 125, 3826 [NASA ADS] [CrossRef] [Google Scholar]
- Kowaka, Y., Yamanaka, T., & Baba, M. 2012, J. Chem. Phys., 136, 154301 [NASA ADS] [CrossRef] [Google Scholar]
- Krishnan, S., Kaden, A., Thilly, G., & Hites, A. 1979, Environ. Sci. Tech., 13, 1532 [NASA ADS] [CrossRef] [Google Scholar]
- Loomis, F. W., & Wood, R. W. 1928, Phys. Rev., 32, 223 [NASA ADS] [CrossRef] [Google Scholar]
- Maksyutenko, P., Zhang, F., Gu, X., & Kaiser, R. I. 2011, Phys. Chem. Chem. Phys., 13, 240 [NASA ADS] [CrossRef] [Google Scholar]
- McGuire, B. A., Burkhardt, A. M., Kalenskii, S., et al. 2018, Science, 359, 202 [Google Scholar]
- McGuire, B. A., Loomis, R. A., Burkhardt, A. M., et al. 2021, Science, 371, 1265 [Google Scholar]
- McNaughton, D., Jahn, M. K., Travers, M. J., et al. 2018, MNRAS, 476, 52678 [Google Scholar]
- Müller, H. S. P., Schlöder, F., Stutzki, J., & Winnewisser, G. 2005, J. Mol. Struct., 742, 215 [Google Scholar]
- Neill, J. L., Shipman, S. T., Alvarez-Valtierra, L., et al. 2011, J. Mol. Spectrosc., 269, 21 [NASA ADS] [CrossRef] [Google Scholar]
- Pickett, H. M. 1991, J. Mol. Spectrosc., 148, 371 [Google Scholar]
- Pickett, H. M., Poynter, R. L., Cohen, E. A., et al. 1998, J. Quant. Spectrosc. Radiat. Transf., 60, 883 [Google Scholar]
- Ray, B. S. 1932, Z. Phys., 78, 74 [NASA ADS] [CrossRef] [Google Scholar]
- Silva, W. G. D. P., Cernicharo, J., Schlemmer, S., et al. 2023, A&A, 676, L1 [NASA ADS] [CrossRef] [EDP Sciences] [Google Scholar]
- Sita, M. L., Changala, P. B., Xue, C., et al. 2022, ApJ, 938, L12 [NASA ADS] [CrossRef] [Google Scholar]
- Smyth, K. C., Lias, S. G., & Ausloos, P. 1982, Combust. Sci. Technol., 28, 147 [CrossRef] [Google Scholar]
- Tercero, F., López-Pérez, J. A., Gallego, J. D., et al. 2021, A&A, 645, A37 [EDP Sciences] [Google Scholar]
- Thorwirth, S., Theulé, P., Gottlieb, C. A., et al. 2007, ApJ, 662, 1309 [NASA ADS] [CrossRef] [Google Scholar]
- Watson, J. K. G. 1977, in Vibration Spectra and Structure, ed. J. Durig (Amsterdam: Elsevier), 6, 1 [Google Scholar]
- Watson, J. K. G. 2007, Mol. Phys., 105, 679 [CrossRef] [Google Scholar]
- Yang, Z., Galimova, G. R., He, C., et al. 2023, Sci. Adv., 9, eadi5060 [NASA ADS] [CrossRef] [Google Scholar]
Appendix A: Confirmation of the presence of cyanonaphthalenes in TMC-1
Fit of the Ka = 0 lines of 1-cyanonaphthalene in the Q-band.
As noted in Sect. 3, we were looking for harmonic relations with half integer quantum numbers that could be related to C7N. A dozen lines were found that, as explained in Sect. 3, could be fitted with a simple relation ν = 2 BeffJ* − 4 DeffJ* 3. These lines are shown in Fig. A.1 (lines connected with the blue line at the left). Each panel of this figure represents the data of the survey with frequencies 2 BrotJ*, with J* being Ju + 1/2 and Ju the integer upper quantum number of the transitions Ka = 0, 1 of 1-cyanonaphthalene. This species has a- and b-type transitions, with similar values of the dipole moment (McNaughton et al. 2018), and has the peculiarity that the a-type J′0, J′ − J″0, J″ and J′1, J′ − J″1, J″ with J″=J′−1 collapse to the same frequency than the b-type J′1, J′ − J″0, J″ and J′0, J′ − J″1, J″. Hence, the four Ka = 0, 1 a- and b-lines are at the same frequency which produces a natural stacking favouring the detection of these lines. These four transitions with Ka = 0,1 will be denoted as J′−J″(0,1). Examples of them are given in Fig. A.2 where the quantum numbers J′ and J″ are indicated. All lines in this figure labelled as J′−J″(n,n+1) correspond to two a- and two b-type collapsed transitions with upper and lower rotational quantum numbers J′ and J″, respectively.
The Ray asymmetry parameter (Ray 1932), κ = (2B − A − C)/(A − C), of 1-cyanonaphthalene is around −0.1, hence, the molecule is highly asymmetric. Nevertheless, a clear series of lines harmonically related appear in the diagram of Fig. A.1 as connected by a vertical line slightly tilted due to the contribution of the rotational distortion to the frequencies of the transitions. The calculated frequencies of these transitions using the rotational and distortion constants derived by McNaughton et al. (2018) are given in Table A.1, together with the fitted frequencies assuming that the lines arise from a linear molecule with half integer quantum numbers. The match between the frequencies calculated using an A-reduced Hamiltonian (representation Ir) for an asymmetric molecule and those obtained from a Hamiltonian for a linear molecule with half integer quantum numbers (J*=Ju+1/2) is simply astonishing.
 |
Fig. A.1. Modified Loomis-Wood diagram of some of the observed lines of 1-cyanonaphthalene. The abscissa corresponds to the value of the rotational constant. The ordinate is the antenna temperature, corrected for atmospheric and telescope losses, in milli Kelvin. Each box presents the QUIJOTE data for frequencies 2 BrotJ*, where J* = Ju + 1/2. The red line corresponds to the synthetic spectrum computed for TMC-1 including the rotational transitions of all molecular species detected with QUIJOTE adopting for them the physical parameters derived in previous works. Features without a red line counterpart are unknown lines. The model contains the rotational lines of the two isomers of cyanonaphthalene and cyanoacenaphtylene reported in this work. The rotational transitions of 1-cyanonaphthalene correspond to the lines connected through blue lines (see text). The left blue line corresponds to the transitions harmonically related with half integer quantum numbers (Ka = 0, 1; a and b-type transitions; Ju=J*-1/2). The other blue lines connect transitions of 1-cyanonaphthalene corresponding to Ka = 1, 2, 3 and 4 (a and b-type). |
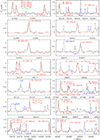 |
Fig. A.2. Some of the lines of Fig. A.1 over enhanced frequency scales. The lines are indicated by arrows and their quantum numbers are depicted for each feature. The red line corresponds to the synthetic spectra derived from the model presented in Sect. 4. Other lines from molecules previously studied or unknown features are indicated in blue. |
The values of Beff and Deff derived through the linear fit are 580.987413 ± 0.000015 MHz, and 4.9354 ± 0.0057 Hz, respectively. The parameter Beff agrees extremely well with the rotational constant C derived by McNaughton et al. (2018, C = 580.988976 ± 0.000006 MHz). It should be pointed out that the Ka = 0, 1 lines cannot be reproduced with a fit to a linear species using integer quantum numbers. The additional series of lines that appear in the figure correspond to Ka values of 1, 2, 3, and 4 of a and b type. They appear connected by significantly curved blue lines due to the high contributions of non-diagonal terms of the Hamiltonian and of the distortion terms of the molecule. In Fig. A.2 we show a zoom for several of these lines to illustrate that they are clearly detected on a line-by-line basis. The behaviour of the Ka = 0, 1 lines of 1-cyanonaphthalene is the expected result for high-J values of large molecules (Watson 2007). In this case, the lines of an asymmetric top in the oblate asymptotic limit (J=Kc), or the prolate asymptotic limit (J=Ka), collapse to a single feature producing strong lines separated by 2C or 2A that appear as progressions in the spectrum. Up to four lines can be collapsed to the same frequency (see, e.g., Fig. A.2).
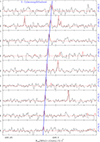 |
Fig. A.3. Modified Loomis-Wood diagram for the observed Ka = 0,1 lines of 2-cyanonaphthalene. The abscissa corresponds to the value of the rotational constant. The ordinate is the antenna temperature, corrected for atmospheric and telescope losses, in milli Kelvin. Each box presents the QUIJOTE data for frequencies 2 BrotJ*, where J* = Ju + 1/2. The red line corresponds to the synthetic spectrum computed for TMC-1 including the rotational transitions of all molecular species detected in previous works and the two isomers of cyanonaphthalene and cyanoacenaphthylene. The rotational transitions of 2-cyanonaphthalene correspond to the lines connected through the blue vertical line (see text). For this isomer of cyanonaphthalene they correspond to the a-type transitions harmonically related with half integer quantum numbers, J*, and corresponding to Ju = J+ − 1/2 and Ka = 0, 1. |
The lines of the isomer 2-cyanonaphthalene are shown in Fig. A.3. For this isomer the Ray’s asymmetry parameter, κ, is −0.9, which means that the species is near the prolate symmetric limit (κ = −1). For this isomer, the spectrum is dominated by a-type transitions, which are 25 times stronger than the b-type ones (μa = 5.2 D, μb = 1.0 D; McNaughton et al. 2018). For J′ = 31 the two Ka = 0 and Ka = 1 lines are separated by 100 kHz (see top panel of Fig. A.3), while for J′ = 35 the splitting of the two lines is only of 30 kHz and appear unresolved in our data (see panel corresponding to J* = 71/2 in Fig. A.3). The a-type J′−J″(0,1) lines can be reproduced with Beff = 495.317 MHz, Deff = 13.2 Hz, and Heff = 1.53 μHz with a standard deviation of 19 kHz. A better result (5.8 kHz) is obtained by fitting an additional distortion term. The effective rotational constant using half integer quantum numbers for these Ka = 0, 1 transitions is very similar to the C rotational constant (C = 495.29352 MHz) derived for this isomer by McNaughton et al. (2018). Additional lines with higher Ka values are shown in Fig. A.4.
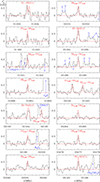 |
Fig. A.4. Additional lines of 2-cyanonaphthalene (see Fig. A.3). The quantum numbers are indicated for each feature. The red line corresponds to the synthetic spectra of the model for 2-cyanonaphthalene presented in Sect. 4. Other lines from molecules previously studied or unknown features are indicated in blue. |
Appendix B: Line parameters of the two CNACY isomers
Line parameters for all observed transitions with the Yebes 40m radio telescope were derived by fitting a Gaussian line profile to them using the GILDAS package. A velocity range of ±20 km s−1 around each feature was considered for the fit after a polynomial baseline was removed. Negative features produced in the folding of the frequency switching data were blanked before baseline removal. A view of some of the transitions of the two isomers of CNACY is given in figures 1 and 2.
Observed line parameters towards TMC-1 for the two isomers of CNACY$.
Appendix C: Quantum chemical calculations
Molecular geometry optimizations for all the plausible candidates were carried out using the density functional theory (DFT) variant B3LYP (Becke 1993) and the Pople triple-ζ basis set 6-311++G(d,p) (Frisch et al. 1984)). From these calculations we obtained the values of the rotational constants and those of the electric dipole moment components. In addition, for some of the candidates we also performed harmonic frequency calculations at the same level of theory. All the calculations were done using the GAUSSIAN 16 package (Frisch et al. 2016). We chose this calculation method since it reproduces fairly well the rotational constants of the PAHs and their cyano derivatives at a reasonable computational cost, as shown in McNaughton et al. (2018). See also as an example the comparative theoretical and experimental values obtained for acenaphthylene, shown in Table C.1.
We considered as plausible candidates the cyano derivatives of the PAHs with three fused rings: anthracene and phenanthrene (c-C14H10), 9H-fluorene (c-C13H10), acenaphtene (c-C12H10), and acenaphtylene (c-C12H8). In addition, we also calculated the molecular constants for the dicyano derivatives of naphthalene.
The molecular structures for all the isomers of cyanoanthracene (CNA) and cyanophenanthrene (CNP) are shown in Figs. C.1 and C.2, while the theoretical molecular constants are given in Table C.2 and C.3, together with those experimentally determined for the 9-cyanoanthracene (9-CNA) and 9-cyanophenanthrene (9-CNP) isomers, observed in the laboratory by McNaughton et al. (2018). The molecular constants for the cyano derivatives of 9H-fluorene (CNF) have been already published by Cabezas et al. (2024) together with the experimental constants, that are shown in Table C.4. The calculated molecular constants for the five cyano derivatives of acenaphtene (CNAC) are shown in Table C.5 and their molecular structures in Fig. C.3 and those for the acenaphtylene are summarized in Table C.1. Finally the theoretical rotational constants for the ten different dicyano derivatives of naphthalene (DCN) are shown in Table C.6 and the molecular structures in Fig. C.4.
Experimental and theoretical molecular constants of acenaphthylene.
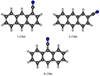 |
Fig. C.1. Chemical structure of the CNA isomers. |
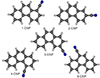 |
Fig. C.2. Chemical structure of the CNP isomers. |
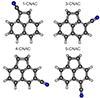 |
Fig. C.3. Chemical structure of the CNAC isomers. |
Molecular constants for the CNA isomers.
Theoretical molecular constants of CNP isomers.
Experimental molecular constants of CNF isomers from Cabezas et al. (2024).
Theoretical molecular constants of the CNAC isomers.
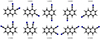 |
Fig. C.4. Chemical structuresof the DCN isomers. |
Theoretical molecular constants of the DCN isomers.
Appendix D: Synthesis of cyanoacenaphthylene isomers
The synthesis of 1-CNACY and 5-CNACY was accomplished through short, three-step synthetic routes, starting from commercially available acenaphthene (see Figs. D.1 and D.2). Thus, benzylic dibromination of acenaphthene with NBS in the presence of benzoyl peroxide afforded 1,2-dibromoacenaphthene, which after dehydrobromination with DBU and cyanodebromination with CuCN, was converted into 1-CNACY in good yield. In contrast, treatment of acenaphthene with NBS in the absence of the radical initiator resulted in bromination at position C5, yielding 5-bromoacenapthene in quantitative yield. Cyanodebromination followed by oxidation with DDQ afforded 5-CNACY in satisfactory yield.
In contrast, the 3-CNACY and 4-CNACY isomers are not accessible in a straightforward manner. In fact, they have never been prepared previously, and even the synthesis of potential precursors such as 3- or 4-bromoacenaphthylenes or -acenaphthenes would be difficult. The reason is that the reactive positions of acenaphthene are C1 (for radical reactions) and C5 (for electrophilic aromatic substitution), as shown in our synthesis. Moreover, selective functionalization of acenaphthylene in positions C3 or C4 has not been reported.
The detailed experimental procedures for the synthesis of 1-CNACY and 5-CNACY are below.
D.1. Experimental procedures and characterization data
1-CNACY and 5-CNACY were synthesized according to adapted literature procedures(Anderson & Anderson 1955; Krishnan et al. 1979; Broadus & Kass 2001; Jena et al. 2020). All reactions were carried out under argon using oven-dried glassware. Anhydrous THF and DMF were taken from a MBraun SPS-800 Solvent Purification System. 1-Cyanoacenaphthylene and 5-cyanoacenaphthylene were prepared following a published procedure. Other commercial reagents were purchased from ABCR GmbH, Sigma-Aldrich or Fluorochem, and were used without further purification. TLC was performed on Merck silica gel 60 F254 and chromatograms were visualized with UV light (254 and 360 nm). Column chromatography was performed on Merck silica gel 60 (ASTM 230-400 mesh). Centrifugation was performed in a Hettich EBA21 centrifuge. 1H and 13C NMR spectra were recorded at 300 and 75 MHz (Varian Mercury-300 instrument), 400 and 101 MHz (Varian Inova 400) or 500 and 125 MHz (Varian Inova 500) respectively. Low resolution mass spectra (EI) were obtained at 70 eV on a HP-5988A instrument, while high-resolution mass spectra (HRMS) were obtained on a Micromass Autospec spectrometer. Atmospheric pressure chemical ionization (APCI) HRMS were obtained on a Bruker Microtof, using Direct Inlet Probe (DIP).
 |
Fig. D.1. Synthesis of 1-CNACY. |
 |
Fig. D.2. Synthesis of 5-CNACY. |
D.1.1. Synthesis of 1,2-dibromo-1,2-dihydroacenaphthylene
To a stirred solution of acenaphthene (500 mg, 3.24 mmol) and NBS (1.32 g, 7.45 mmol) in CHCl3 (6.5 mL), benzoyl peroxide (BPO, 78.5 mg, 0.32 mmol) was added, and the mixture stirred at reflux for 2h. Solid succinimide was filtered and the filtrate was evaporated under reduced pressure. The crude product was purified by column chromatography (SiO2, hexane) affording 1,2-dibromo-1,2-dihydroacenaphthylene as a yellow solid (575 mg, 57%). 1H-NMR (300 MHz, CDCl3), δ: 7.82 (dd, J = 6.7, 2.3 Hz, 2H), 7.67-7.59 (m, 4H), 6.01 (s, 2H) ppm. 13C-NMR-DEPT (75 MHz, CDCl3), δ: 140.51(2xC), 134.83 (C), 130.99 (C), 128.84 (2xCH), 125.86 (2xCH), 122.55 (2xCH), 54.91 (2xCH) ppm. HRMS (APCI-DIP-TOF) for C12H8Br2 ([M+]) Calcd.: 308.8909; Found: 309.8911.
D.1.2. Synthesis of 1-bromoacenaphthylene
A mixture of 1,2-dibromo-1,2-dihydroacenaphthylene (500 mg, 1.6 mmol) and DBU (292.8 mg, 1.92 mmol) in DMF (32 mL) was stirred at 85 oC for 4h. Once the mixture reached room temperature it was poured in ice water, extracted with Et2O (3x25mL) and the combined organic layers were washed with 1M HCl (15mL) and saturated NaHCO3 (15 mL), dried over Na2SO4, filtered and concentrated under reduced pressure. The crude product was purified by column chromatography (SiO2, hexane) affording 1-bromonaphthylene as a brown solid (323 mg, 91%). 1H-NMR (300 MHz, CDCl3), δ: 7.87 (d, J = 8.0 Hz, 1H), 7.78 (d, J = 8.2 Hz, 1H), 7.70 (d, J = 6.9 Hz, 1H), 7.61 (t, J = 7.4 Hz, 2H), 7.53-7.47 (m, 1H), 7.15 (s, 1H) ppm. 13C-NMR-DEPT (75 MHz, CDCl3), δ: 138.22 (C), 137.98 (C), 128.94 (C), 128.89 (CH), 128.49 (CH), 127.94 (CH), 127.67 (C), 127.63 (CH), 127.04 (CH), 123.65 (CH), 123.47 (CH), 120.73 (C) ppm. HRMS (APCI-DIP-TOF) for C12H8Br ([M+H+]) Calcd.: 230.9804; Found: 230.9796.
D.1.3. Synthesis of 1-CNACY.
A mixture of 1-bromoacenaphthylene (294 mg, 1.27 mmol) and CuCN (228 mg, 2.54 mmol) in 1.3 mL of DMA was stirred at reflux for 6h. After the mixture reached room temperature, CH2Cl2 was added, and the resulting precipitate was filtered and washed with CH2Cl2. The filtrate was washed with water (15 mL) and dried over Na2SO4 and concentrated under reduced pressure. The crude product was purified by column chromatography (SiO2, hexane/ CH2Cl2 4:1) affording 1 as a red solid (146 mg, 69%). 1H-NMR (300 MHz, CDCl3), δ: 8.04 (d, J = 8.2 Hz, 1H), 7.99-7.91 (m, 3H), 7.74 (s, 1H), 7.71-7.65 (m, 2H) ppm. 13C-NMR-DEPT (75 MHz, CDCl3), δ: 139.82 (CH), 136.19 (C), 136.10 (C), 130.83 (CH), 129.23 (CH), 128.53 (CH), 128.43 (C), 128.28 (CH), 128.10 (CH), 127.23 (C), 124.71 (CH), 115.89 (C), 111.34 (C).ppm. HRMS (APCI-DIP-TOF) for C13H7N ([M+H+]) Calcd.: 178.0651; Found: 178.0655.
D.1.4. Synthesis of 5-bromoacenaphthene
To a stirred solution of acenaphthene (2 g, 12.96 mmol) in dry DMF (13 mL), NBS (2.33 g, 13.13 mmol) was added in three portions and the mixture stirred at room temperature for 2 h. After that, the mixture was then transferred to a flask with ice-cold water. The precipitate was filtered and washed with H2O and dried under vacuum affording 5 as s white solid (3 g, 99%). 1H-NMR (300 MHz, CDCl3), δ: 7.77 (d, J = 8.4 Hz, 1H), 7.66 (d, J = 7.3 Hz, 1H), 7.54 (t, J = 7.8 Hz, 1H), 7.33 (d, J = 7.0 Hz, 1H), 7.13 (d, J = 7.5 Hz, 1H) 3.45-3.37 (m, 2H), 3.35 (m, 2H) ppm. 13C-NMR-DEPT (75 MHz, CDCl3), δ: 146.22 (C), 145.93 (C), 140.28 (C), 130.93 (C), 130.88 (CH), 129.04 (CH), 121.77 (CH), 120.16 (CH), 120.03 (CH), 116.79 (C), 30.63 (CH2), 29.91 (CH2)ppm. HRMS (APCI-DIP-TOF) for C12H9Br ([M+H+]) Calcd.: 232.9960; Found: 232.9959.
D.1.5. Synthesis of 5-cyanoacenaphthene
A mixture of 5-bromoacenaphthene (234 mg, 1.04 mmol) and CuCN (146.3 mg, 1.63 mmol) in DMF (3 mL) was stirred at reflux for 6h. After the mixture reached room temperature, CH2Cl2 was added, and the resulting precipitate was filtered and washed with CH2Cl2. The filtrate was washed with water (15 mL) and dried over Na2SO4 and concentrated under reduced pressure. The crude product was purified by column chromatography (SiO2, hexane/ CH2Cl2 4:1) affording 5-cyanoacenaphthene as a yellow solid (100 mg, 56%) 1H-NMR (300 MHz, CDCl3), δ: 7.88 (d, J = 8.3 Hz, 1H), 7.85 (d, J = 7.2 Hz, 1H), 7.65 (dd, J = 8.3, 7.0 Hz, 1H), 7.44-7.42 (m, 1H), 7.32 (dt, J = 7.2, 0.8 Hz, 1H), 3.46 (d, J = 1.0 Hz, 4H) ppm. 13C-NMR-DEPT (75 MHz, CDCl3), δ: 153.12 (C), 147.24 (C), 139.12 (C), 135.05 (CH), 131.39 (C), 130.87 (CH), 121.52 (CH), 120.61 (CH), 119.27 (CH), 118.55 (C), 105.21 (C), 31.34 (CH2), 30.74 (CH2) ppm. HRMS (APCI-DIP-TOF) for C13H9N ([M+H+]) Calcd.: 180.0257; Found: 180.0296.
D.1.6. Synthesis of 5-CNACY.
A mixture of 5-cyanoacenaphthene (100 mg, 0.55 mmol) and DDQ (693 mg, 3.05 mmol) in dry chlorobenzene (12 mL) was stirred at reflux for 6h. After that, the solvent was evaporated under reduced pressure and the crude product was purified by column chromatography (SiO2, hexane/ CH2Cl2 4:1) affording 5-cyanoacenaphthylene (5-CNACY) as a yellow solid (56 mg, 57%). 1H-NMR (300 MHz, CDCl3), δ: 8.03-8.01 (m, 1H), 7.94 (d, J = 7.1 Hz, 1H), 7.74-7.62 (m, 3H), 7.18 (d, J = 5.3 Hz, 1H), 7.03 (d, J = 5.3 Hz, 1H). ppm. 13C-NMR-DEPT (75 MHz, CDCl3), δ: 144.70 (C), 140.25 (C), 134.82 (CH), 133.40 (CH), 130.42 (CH), 129.50 (CH), 128.52 (C), 127.78 (C), 126.32 (CH), 125.37 (CH), 123.32 (CH), 118.03 (C), 109.54 (C) ppm. HRMS (APCI-DIP-TOF) for C13H7N ([M+H+]) Calcd.: 178.0651; Found: 178.0651.
Appendix E: CP-FTMW spectral measurements
The experimental setup employed in this work consists of a direct-digital broadband chirped-pulse Fourier-transform microwave (CPFTMW) spectrometer (Neill et al. 2011) working over 2-8 GHz and located at the Universidad de Valladolid. The solid samples of 1-CNACY and 5-CNACY were vaporized at ∼120°C in a solenoid-driven pulsed injector and diluted with an inert carrier gas (pure Ne at 2 bar). The CNACY species then expanded near adiabatically into an evacuated chamber, generating molecular jet pulses (typ. 800 μs) with effective rotational temperatures of 2 K. The molecules of each gas pulse were polarized with a series of 8 microwave chirp pulses (4 μs duration) covering the full frequency range. The measurements were performed at a repetition rate of 5 Hz, giving an effective repetition rate of 40 Hz. The chirp pulses were generated with an arbitrary waveform generator (Tektronix AWG 70002A, 25 GS/sec), amplified to 250 W with a traveling-wave tube amplifier (TWT). The excitation radiation was broadcasted perpendicularly to the jet propagation through a horn antenna. A molecular transient emission, spanning 40 μs, was then detected through a second receiving horn and amplified by a low-noise MW amplifier. A total of 1200 k FIDs per measurement were finally co-added on a digital oscilloscope (Tektronix DPO 70804C, 25 GS/sec) and a Fourier transformation finally yielded the resonance frequencies of the rotational transitions. The use of a Kaiser-Bessel apodization window produced linewidths of ca. 100 kHz. The accuracy of the frequency measurements is better than 25 kHz. All frequency components are referenced to a Rb standard.
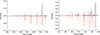 |
Fig. E.1. Broadband microwave spectra of 1-CNACY (left) and 5-CNACY (right) in the region 2-8 GHz. The experimental trace is represented by the positive black trace. The negative red trace is a simulation (at 2 K) using the fitted rotational parameters of Tables E.1 and E.2. |
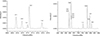 |
Fig. E.2. Hyperfine spectra of the 21, 1 − 10, 1 rotational transition of 1-CNACY (left panel) and 42, 3 − 32, 2 and 22, 0 − 11, 1 rotational transitions of 5-CNACY (right panel). Each hyperfine component is labelled with the corresponding values of quantum numbers F′-F″ (F=I+J). |
The two CNACY isomers have high μa dipole moment components, 5.6 D and 4.6 D, respectively for 1-CNACY and 5-CNACY. In addition, 5-CNACY species shows a μb dipole moment of 1.0 D. A very rich rotational spectrum is therefore observed for both isomers (see Fig. E.1). The presence in the CNACY isomers of a 14N-nitrogen nucleus, which has a nonzero nuclear spin (I = 1), causes each rotational transition to be split into several hyperfine components because of the nuclear quadrupole coupling effects (see Fig. E.2). Therefore, the final dataset for the 1-CNACY isomer consists of 313 hyperfine components corresponding to a-type R- and Q-branch rotational transitions with maximum values of J and Ka quantum numbers of 12 and 5, respectively. For 5-CNACY, we measured a total of 499 hyperfine components, including a- and b-type R- andQ-branch rotational transitions with maximum values of J and Ka quantum numbers of 11 and 5, respectively. All the observed hyperfine components were fitted using the SPFIT program (Pickett 1991) with the A-reduction of the Watson’s Hamiltonian and IIIl representation (Watson 1977). We chose this fitting method since it was employed by Thorwirth et al. (2007) to fit the spectroscopic data of the acenaphthylene molecule. A combined fit of the laboratory and TMC-1 data for each isomer provides improved values for the molecular parameters. A summary of all the obtained results is shown in Tables E.1 and E.2 while all the measured transitions for 1-CNACY and 5-CNACY isomers are given in Tables E.3 and E.4. The observations corresponding to the monosubstituted 13C isotopologues will be reported separately.
The experimental molecular constants for both isomers agree very well those obtained by quantum chemical calculations. As mentioned before, we chose the IIIl representation. However, the values for the centrifugal distortion constants are calculated in the IIIr representation, and thus, the signs of the off-diagonal quartic constants, δJ and δK, are reversed. This fact also occurs in the case of acenaphthylene as can be seen in the data presented in Table C.1.
Experimental and theoretical molecular constants of 1-CNACY.
Experimental and theoretical molecular constants of 5-CNACY.
Laboratory-observed transition frequencies for 1-CNACY $.
Laboratory-observed transition frequencies for 5-CNACY $.
Appendix F: Chemical routes for the formation of acenaphthylene
Taking into account the peculiar physical conditions of TMC-1 we have to explore barrier-less bimolecular reactions to reach the production of acenaphthylene. We describe below three different chemical routes that could be considered in the chemical networks for these large PAHs in cold dark clouds.
F.1. Formation of 1- and 5-CNACY
In this route we consider that acenaphthylene is formed first and then it reacts with cyano radicals through a barrierless addition-substitution reaction. In this case we have the question of why only 1- and 5-CNACY are formed with similar abundances and not the 3- and 4-isomers.
Acenaphthylene can be formed by four subroutes involving in principle C11+C1, C10+C2, C9+C3 and C8+C4 reactions. However, none of the C8+C4 reactions, C8H8+C4H and C8H7+C4H2, can form acenaphthylene.
The reactions C11+C1 are highly unlikely. Among two of these routes it is worth to mention the reaction of atomic carbon and methyl-naphthalene (C11H10; no yet detected in TMC-1). However, this reaction requires a loss of H2 and an insertion of C, C11H10 + C → C12H8 + H2. The reaction could start by the insertion of C in the CH3 group while it is known that C attacks preferentially the aromatic rings as shown in X-beams experiments (Hahndorf et al. 2002, and references therein). Hence, although possible in principle, this pathway is very unlikely.
We could also consider the reaction between atomic carbon and the radical obtained by loss of an hydrogen of the CH3 group of methylnaphthalene. The reaction could be C11H9 + C → C12H8 + H. As commented previously, C prefers to attack the aromatic rings and, hence, this pathway is also very unlikely.
Finally, for the C10+C2 path the reaction of the naphthyl radical with acetylene C11H7+C2H2 → C12H8 + H does form acenaphthylene, but there is a barrier which cannot be overcome under TMC-1 conditions. However, the reaction of naphthalene with the ethynyl radical (C2H) forms on the paper acenaphthylene (along with 1- and 2-ethynylnaphthalene), C10H8 + C2H → C12H8 + H. This reaction has to be calculated. As discussed in Sect. 4 is one of the most likely pathways to form the acenaphthylenes.
Among the reactions of C9 + C3 to consider, that of indene with C3H which could form on the paper acenaphthylene. This reaction proceeds barrierlessly via addition of CCCH either to the 6- or 5-membered rings, followed by isomerization (ring closure, H shift) and H loss to acenaphthylene (C9H8 + C3H → C12H8 + H). Another possible way is the reaction of the 9-indenyl radical, C9H7, with the HCCCH isomer of C3H2. Molecular beams experiments showed that the the 9-indenyl radical can be formed easily (Yang et al. 2023); also HCCCH – the non-detected C3H2 isomer – can also be formed easily as shown in crossed beams experiments (Maksyutenko et al. 2011). This pathway also proceeds barrierlessly via addition of HCCCH either to the 6 or 5 membered ring followed by isomerization (ring closure, H shift) and H loss to acenaphthylene. These reaction has to be calculated as they are probably important formation routes of acenaphthylene (see Sect. 4).
F.2. Formation of 5-CNACY
In this route we consider that the 5-isomer is formed from 1-cyanonaphthalene which reacts with CCH (routes C10 + C2) to form 5-CNACY. However, the 3- and 4- isomers of CNACY could be also formed in this way. However, 1-CNACY will require additional isomerization. In this route cyanonaphthalene is formed first. The reaction has to be calculated.
F.3. Formation of 1-CNACY
For 1-CNACY we could consider that naphthalene is formed first and that it reacts with CCCN leading to the formation of 1-CNACY, C10H8 + C3N → 1-C12H7CN + H. This reaction has to be calculated.
All Tables
Molecular constants of the cyano isomers of acenaphthylene derived from QUIJOTE data (representation AIr).
All Figures
|
Fig. 1. Modified Loomis-Wood diagram of some of the observed lines of B429 (1-cyanoacenaphthylene). The abscissa corresponds to the value of the rotational constant, which has been fixed in this plot to values of between 429.040 and 429.160 MHz. The ordinate is the antenna temperature – corrected for atmospheric and telescope losses – in millikelvin. Each box presents the QUIJOTE data for frequencies 2 BrotJ*, where J* = Ju + 1/2. The red line corresponds to the synthetic spectrum computed for TMC-1, including the rotational transitions of all molecular species detected with QUIJOTE, adopting for them the physical parameters derived in all previous works. This spectrum contains the rotational lines of the two isomers of cyanoacenaphtylene discovered in this paper. The rotational transitions of 1-cyanoacenaphthylene correspond to those connected through blue lines (see text). The blue line on the left side corresponds to the Ka = 0, 1 transitions that are harmonically related with half-integer quantum numbers. |
| In the text | |
|
Fig. 2. Similar to Fig. 1 but for B444 (5-cyanoacenaphthylene). The range of Brot is from 444.274 to 444.474 MHz. |
| In the text | |
|
Fig. 3. Chemical structure of acenaphthylene (center design) and its cyano derivatives. The numbers label the nitrile substitution positions of the four possible isomers of cyanoacenaphthylene. The isomers detected in this work are 1-CNACY and 5-CNACY, which correspond to B429 and B444, respectively. |
| In the text | |
|
Fig. A.1. Modified Loomis-Wood diagram of some of the observed lines of 1-cyanonaphthalene. The abscissa corresponds to the value of the rotational constant. The ordinate is the antenna temperature, corrected for atmospheric and telescope losses, in milli Kelvin. Each box presents the QUIJOTE data for frequencies 2 BrotJ*, where J* = Ju + 1/2. The red line corresponds to the synthetic spectrum computed for TMC-1 including the rotational transitions of all molecular species detected with QUIJOTE adopting for them the physical parameters derived in previous works. Features without a red line counterpart are unknown lines. The model contains the rotational lines of the two isomers of cyanonaphthalene and cyanoacenaphtylene reported in this work. The rotational transitions of 1-cyanonaphthalene correspond to the lines connected through blue lines (see text). The left blue line corresponds to the transitions harmonically related with half integer quantum numbers (Ka = 0, 1; a and b-type transitions; Ju=J*-1/2). The other blue lines connect transitions of 1-cyanonaphthalene corresponding to Ka = 1, 2, 3 and 4 (a and b-type). |
| In the text | |
|
Fig. A.2. Some of the lines of Fig. A.1 over enhanced frequency scales. The lines are indicated by arrows and their quantum numbers are depicted for each feature. The red line corresponds to the synthetic spectra derived from the model presented in Sect. 4. Other lines from molecules previously studied or unknown features are indicated in blue. |
| In the text | |
|
Fig. A.3. Modified Loomis-Wood diagram for the observed Ka = 0,1 lines of 2-cyanonaphthalene. The abscissa corresponds to the value of the rotational constant. The ordinate is the antenna temperature, corrected for atmospheric and telescope losses, in milli Kelvin. Each box presents the QUIJOTE data for frequencies 2 BrotJ*, where J* = Ju + 1/2. The red line corresponds to the synthetic spectrum computed for TMC-1 including the rotational transitions of all molecular species detected in previous works and the two isomers of cyanonaphthalene and cyanoacenaphthylene. The rotational transitions of 2-cyanonaphthalene correspond to the lines connected through the blue vertical line (see text). For this isomer of cyanonaphthalene they correspond to the a-type transitions harmonically related with half integer quantum numbers, J*, and corresponding to Ju = J+ − 1/2 and Ka = 0, 1. |
| In the text | |
|
Fig. A.4. Additional lines of 2-cyanonaphthalene (see Fig. A.3). The quantum numbers are indicated for each feature. The red line corresponds to the synthetic spectra of the model for 2-cyanonaphthalene presented in Sect. 4. Other lines from molecules previously studied or unknown features are indicated in blue. |
| In the text | |
|
Fig. C.1. Chemical structure of the CNA isomers. |
| In the text | |
|
Fig. C.2. Chemical structure of the CNP isomers. |
| In the text | |
|
Fig. C.3. Chemical structure of the CNAC isomers. |
| In the text | |
|
Fig. C.4. Chemical structuresof the DCN isomers. |
| In the text | |
|
Fig. D.1. Synthesis of 1-CNACY. |
| In the text | |
|
Fig. D.2. Synthesis of 5-CNACY. |
| In the text | |
|
Fig. E.1. Broadband microwave spectra of 1-CNACY (left) and 5-CNACY (right) in the region 2-8 GHz. The experimental trace is represented by the positive black trace. The negative red trace is a simulation (at 2 K) using the fitted rotational parameters of Tables E.1 and E.2. |
| In the text | |
|
Fig. E.2. Hyperfine spectra of the 21, 1 − 10, 1 rotational transition of 1-CNACY (left panel) and 42, 3 − 32, 2 and 22, 0 − 11, 1 rotational transitions of 5-CNACY (right panel). Each hyperfine component is labelled with the corresponding values of quantum numbers F′-F″ (F=I+J). |
| In the text | |
Current usage metrics show cumulative count of Article Views (full-text article views including HTML views, PDF and ePub downloads, according to the available data) and Abstracts Views on Vision4Press platform.
Data correspond to usage on the plateform after 2015. The current usage metrics is available 48-96 hours after online publication and is updated daily on week days.
Initial download of the metrics may take a while.