Fig. 9.
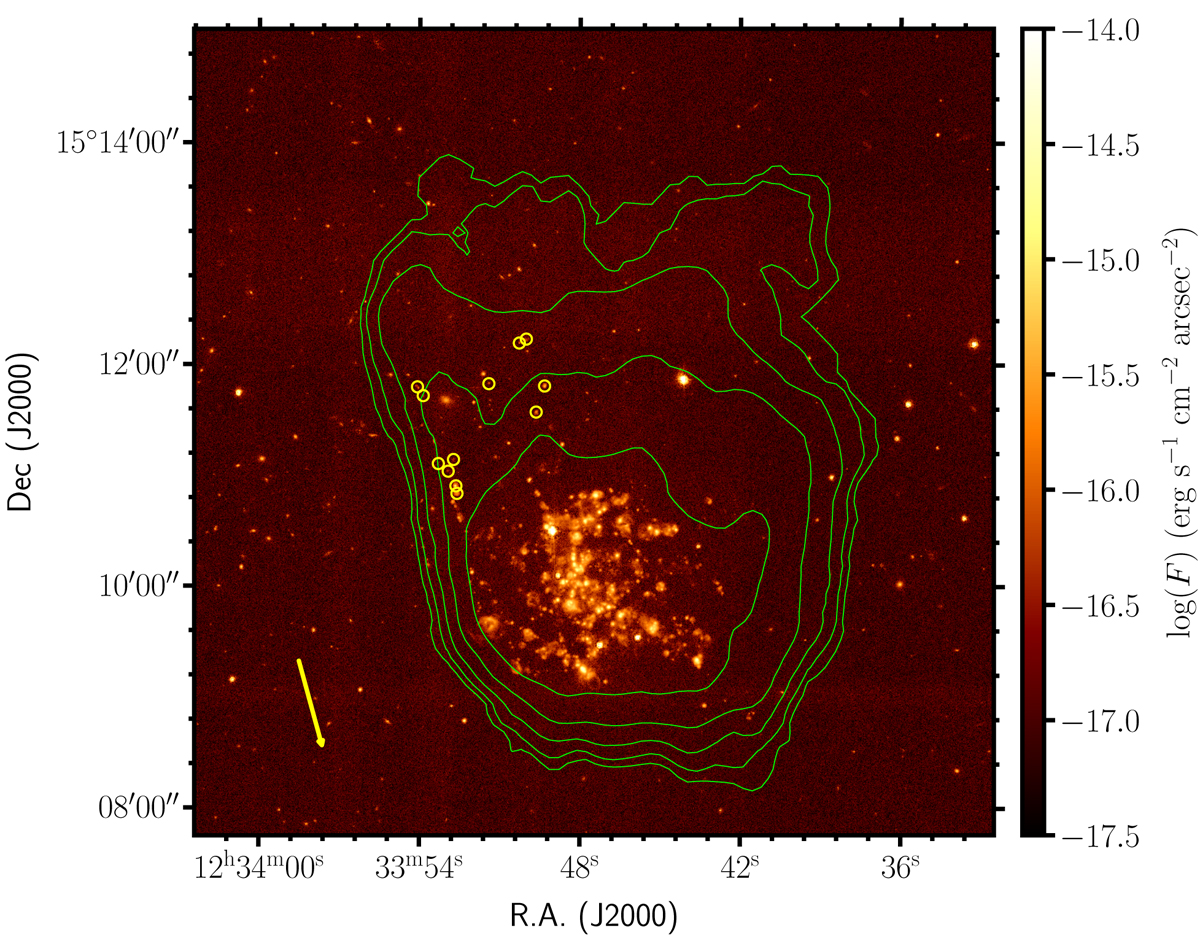
Download original image
H I gas distribution (green contours) overlayed on the continuum-subtracted Hα image of NGC 4523 derived using the VESTIGE narrow-band imaging data. Green contours are shown at column densities of N(HI) = 2n × 3.9 × 1019 cm−2 with n = 0, 1, …5. The colour scale on the right gives the Hα surface brightness in units of erg s−1 cm−2 arcsec−2. The H II regions located outside the stellar disc and analysed in Sect. 6 are identified with yellow circles. The yellow arrow indicates the direction of the cluster centre (M87), located at a projected distance of 0.83 Mpc.
Current usage metrics show cumulative count of Article Views (full-text article views including HTML views, PDF and ePub downloads, according to the available data) and Abstracts Views on Vision4Press platform.
Data correspond to usage on the plateform after 2015. The current usage metrics is available 48-96 hours after online publication and is updated daily on week days.
Initial download of the metrics may take a while.