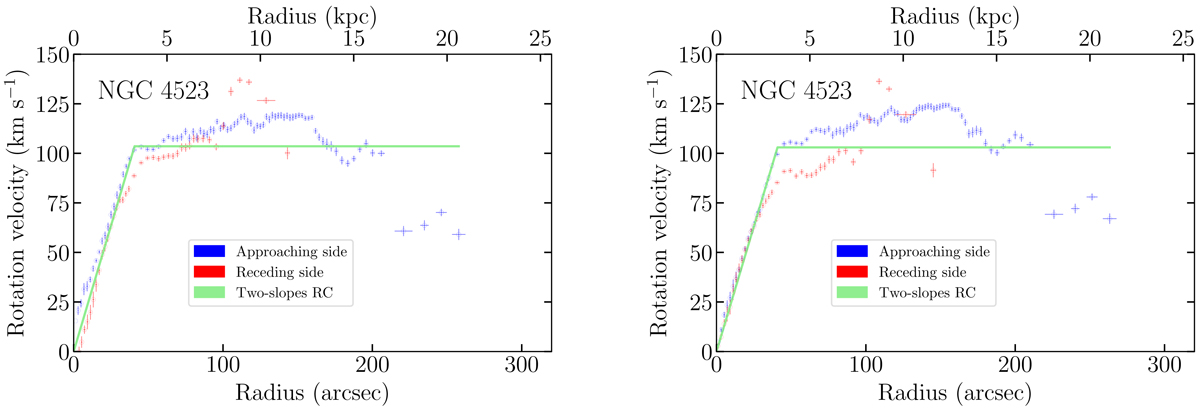
Fig. 7.
Download original image
Rotation curve of NGC 4523 measured from the high-resolution H I velocity field within the modelling approach described in Sect. 5.2. Blue and red squares show the approaching and receding sides of the rotation curve, respectively. The green solid line indicates the best-fitting analytic rotation curve (solid body in the inner regions, and flat in the outer parts). Left panel: rotation curve derived leaving all the fitting parameters free. Right panel: rotation curve derived by shifting the position of the kinematic centre by 4.4″ compared to that in the left panel in order to minimise the difference between the approaching and receding side in the inner regions.
Current usage metrics show cumulative count of Article Views (full-text article views including HTML views, PDF and ePub downloads, according to the available data) and Abstracts Views on Vision4Press platform.
Data correspond to usage on the plateform after 2015. The current usage metrics is available 48-96 hours after online publication and is updated daily on week days.
Initial download of the metrics may take a while.