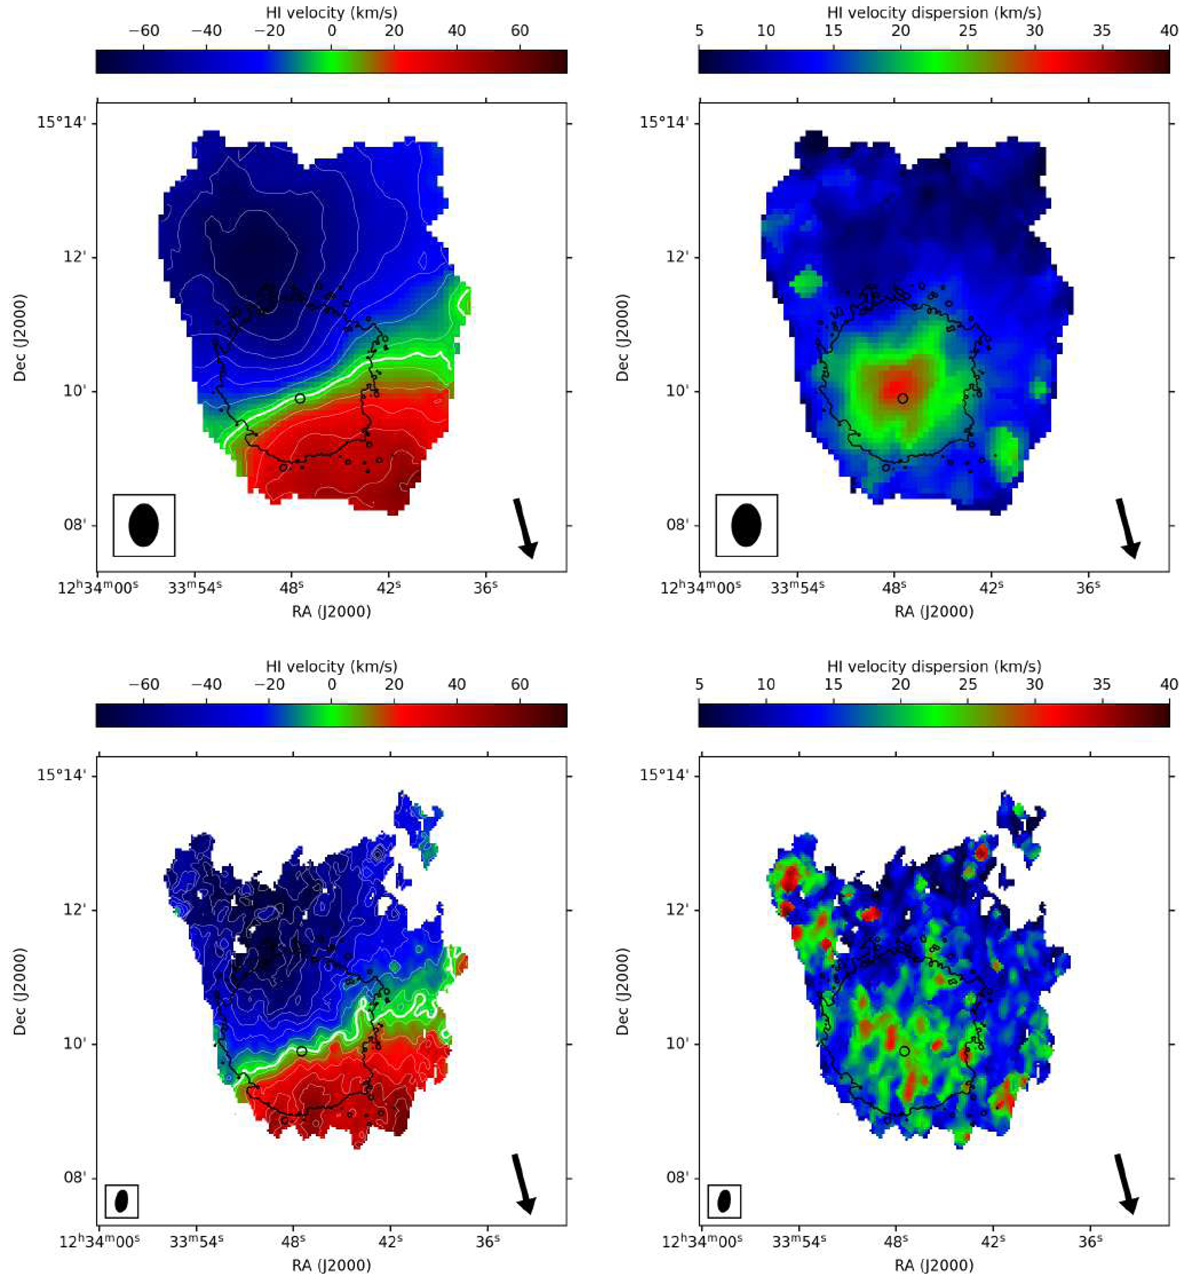
Fig. 5.
Download original image
Low-resolution (27″ × 39″; upper panels) and high-resolution (12″ × 21″; lower panels) H I gas velocity field (moment-1, left) and velocity dispersion (moment 2, right) of NGC 4523. The black contour shows the stellar distribution as traced by the i-band 24.5 mag arcsec−2 isophote. The open dot show the kinematic centre of the galaxy, the black ellipse indicates the beam size and the arrow shows the direction to the cluster centre (M87). The thick white contour represents the systemic velocity of 271 km s−1, and the thinner white contours are drawn at intervals of 10 km s−1.
Current usage metrics show cumulative count of Article Views (full-text article views including HTML views, PDF and ePub downloads, according to the available data) and Abstracts Views on Vision4Press platform.
Data correspond to usage on the plateform after 2015. The current usage metrics is available 48-96 hours after online publication and is updated daily on week days.
Initial download of the metrics may take a while.