Fig. 13.
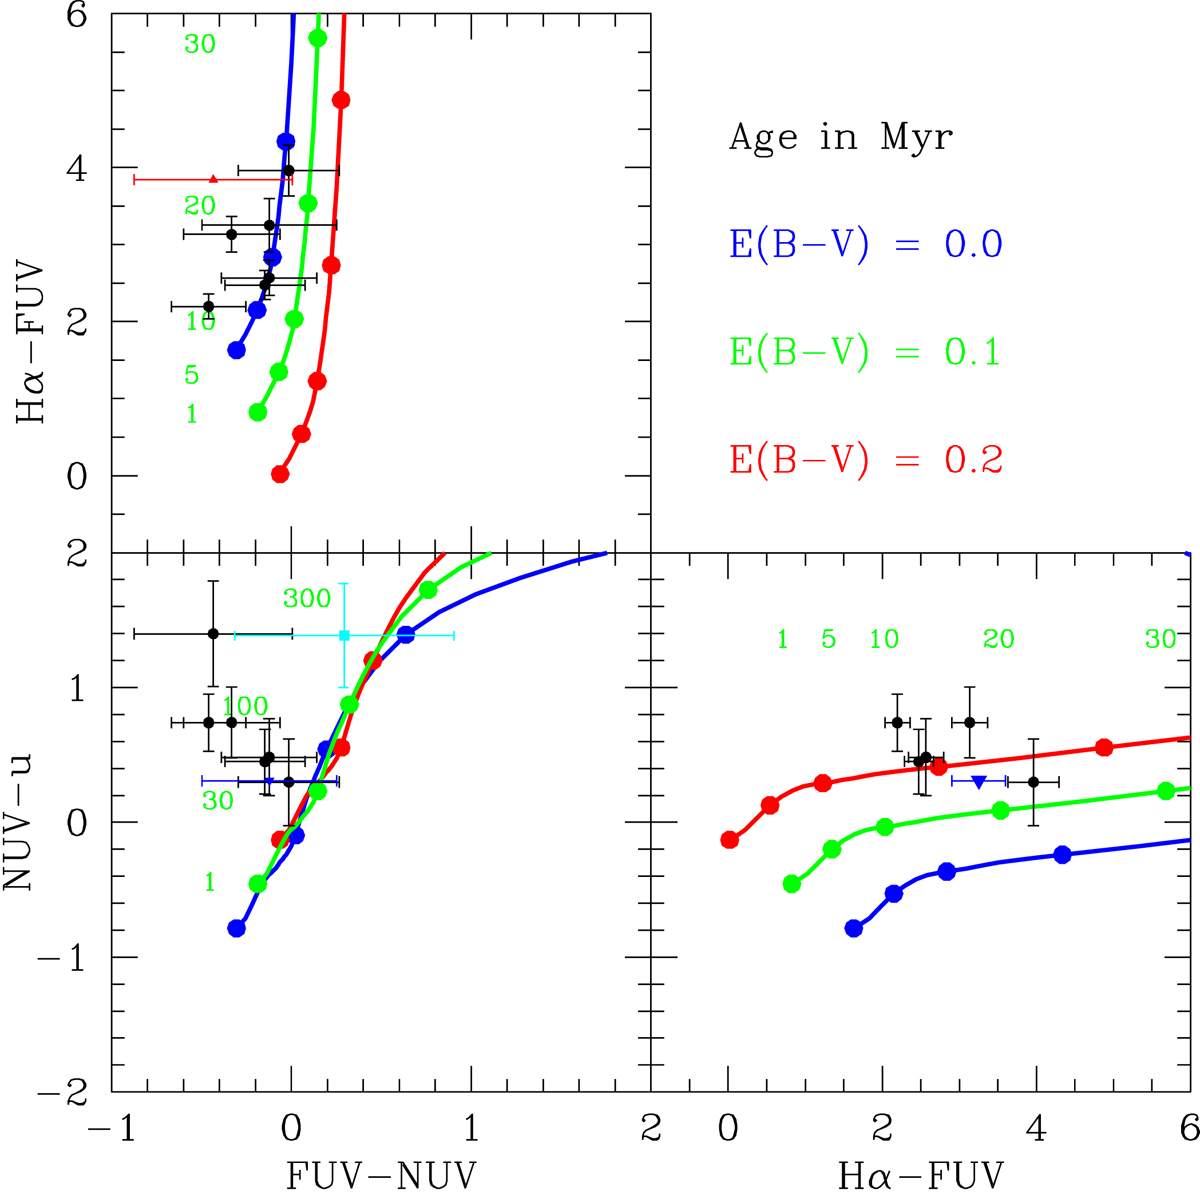
Download original image
Age-sensitive colour-colour diagrams. Upper left: Hα-FUV vs. FUV − NUV, lower left: NUV − u vs. FUV − NUV, lower right: NUV − u vs. Hα-FUV. Black filled dots are for regions detected in all bands, red filled triangles are lower limits in Hα-FUV, blue filled triangles upper limits in NUV − u, while the cyan filled square the mean value for the diffuse extended tail. The blue, green, and red filled dots and solid lines indicate the expected colours at different ages (in Myr) for the assumed star formation history for an E(B − V) = 0.0, 0.1, and 0.2, respectively. The green numbers are the ages in Myr for E(B − V) = 0.1.
Current usage metrics show cumulative count of Article Views (full-text article views including HTML views, PDF and ePub downloads, according to the available data) and Abstracts Views on Vision4Press platform.
Data correspond to usage on the plateform after 2015. The current usage metrics is available 48-96 hours after online publication and is updated daily on week days.
Initial download of the metrics may take a while.