Fig. 3
Download original image
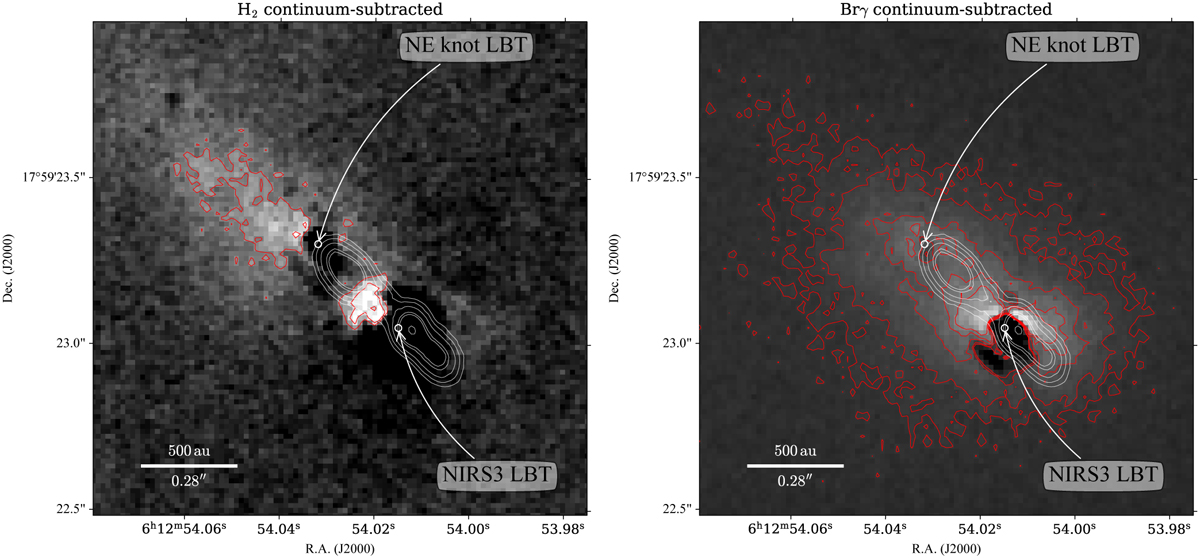
Continuum-subtracted images for the surrounding region of the outbursting source NIRS3. Left panel: H2 continuum-subtracted image. Right panel: Brγ continuum-subtracted image. The red contours represent emission at 3, 5, and 10×RMS, where RMS is the root mean square for each image. The white contours are ALMA band 3 continuum emission, and the contours levels are [0.5, 1.0, 2.0, 4.0, 5.0, 10.0] ×10−3 Jy beam−1.
Current usage metrics show cumulative count of Article Views (full-text article views including HTML views, PDF and ePub downloads, according to the available data) and Abstracts Views on Vision4Press platform.
Data correspond to usage on the plateform after 2015. The current usage metrics is available 48-96 hours after online publication and is updated daily on week days.
Initial download of the metrics may take a while.