Fig. 2
Download original image
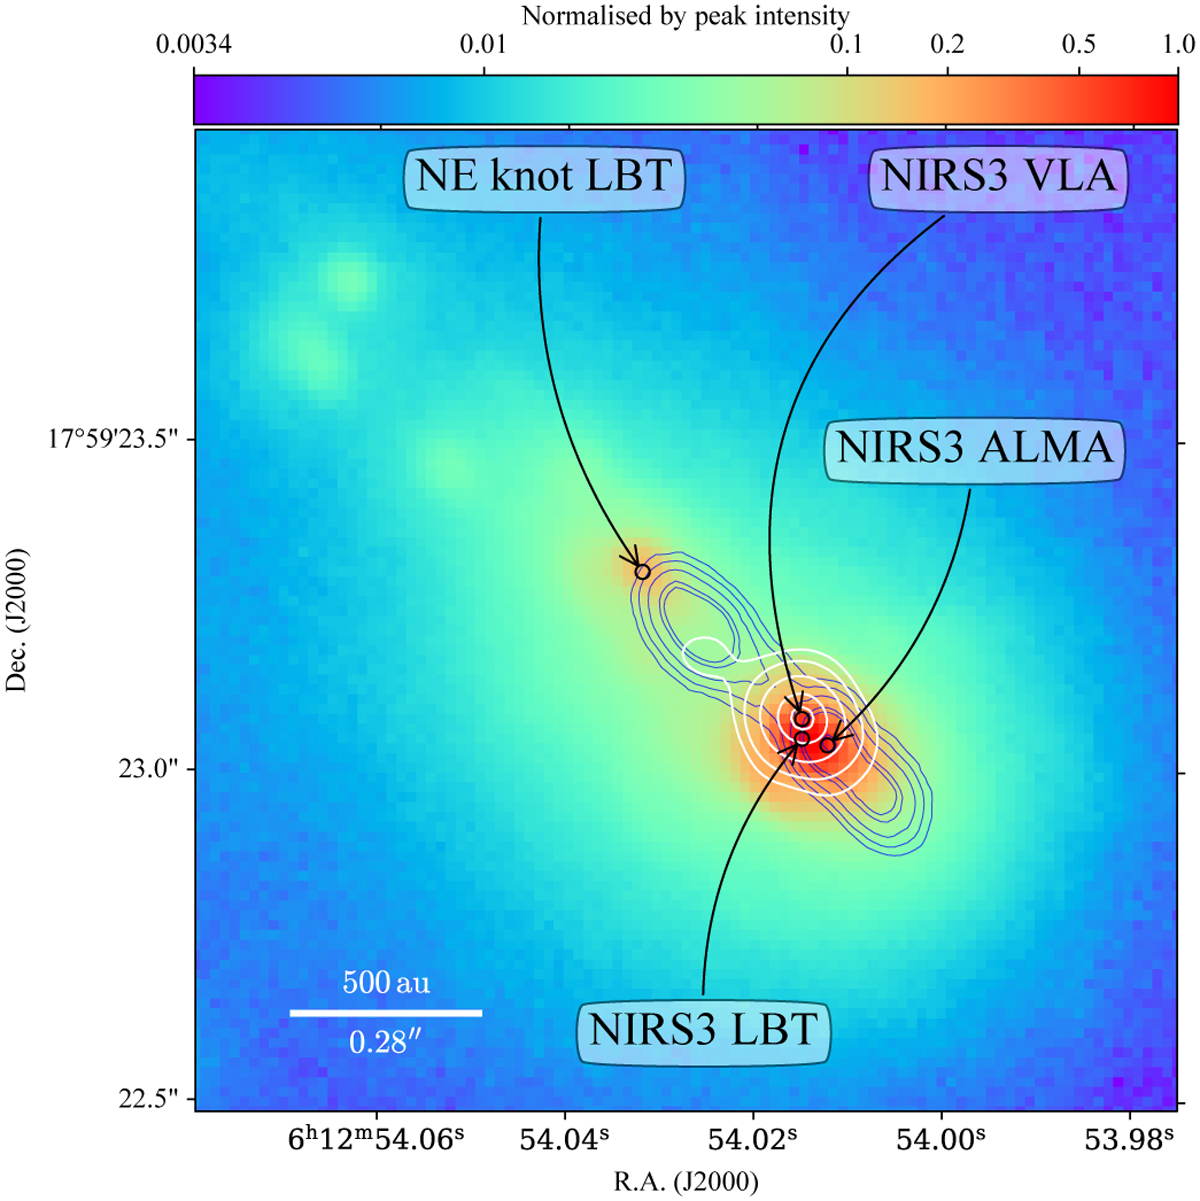
Adaptive optics assisted Ks band image showing zoom-in of the central region of S255IR and featuring NIRS3. The image was normalised to the peak intensity from NIRS3 (labelled NIRS3 LBT) and scaled logarithmically, as shown in the colour bar above the panel. Blue contours represent ALMA band 3 continuum emission with the contour levels [0.5, 1.0, 2.0, 4.0, 5.0, 10.0] ×10−3 Jy beam−1 (Cesaroni et al., in prep.). White contours show VLA 1.3 cm emission with the contour levels [0.8,2.0,5.0,10.0,13.2] ×10−3 Jy beam−1 from Cesaroni et al. (2018). Black circles represent the peak position for NIRS3 and the NE knot for LBT, ALMA, and VLA, as labelled.
Current usage metrics show cumulative count of Article Views (full-text article views including HTML views, PDF and ePub downloads, according to the available data) and Abstracts Views on Vision4Press platform.
Data correspond to usage on the plateform after 2015. The current usage metrics is available 48-96 hours after online publication and is updated daily on week days.
Initial download of the metrics may take a while.