Fig. 5.
Download original image
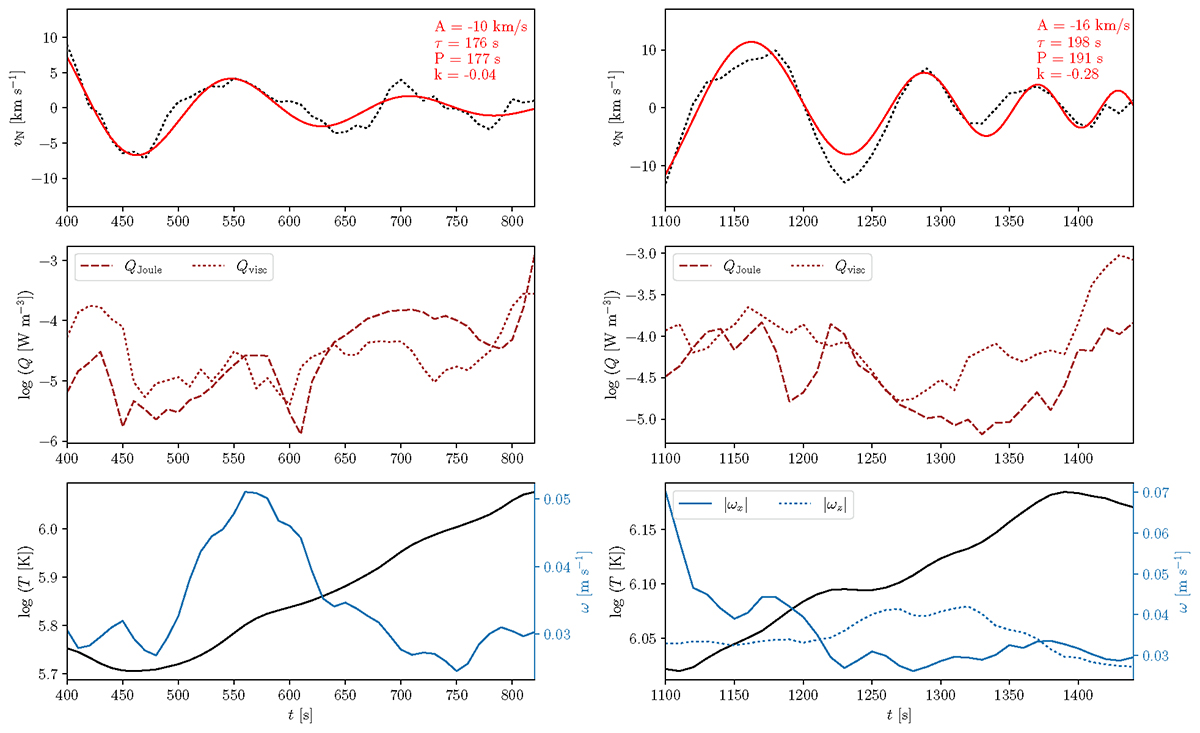
Oscillation time series. Top: evolution of the detrended normal velocity component at the bundle apex averaged over the oscillating field lines in the bundle. The best-fit is shown in red. Middle: evolution of the Joule (dashed line) and viscous volumetric heating rate (dotted line) at the bundle apex. Bottom: temperature (black), the x-component of the vorticity averaged in the vicinity of the bundle apex (solid blue line) and the z-component of the vorticity averaged in the vicinity of the right bundle footpoint (dotted blue line). The time intervals correspond to the time ranges highlighted in blue in Figs. 3 and 4.
Current usage metrics show cumulative count of Article Views (full-text article views including HTML views, PDF and ePub downloads, according to the available data) and Abstracts Views on Vision4Press platform.
Data correspond to usage on the plateform after 2015. The current usage metrics is available 48-96 hours after online publication and is updated daily on week days.
Initial download of the metrics may take a while.