Fig. 4.
Download original image
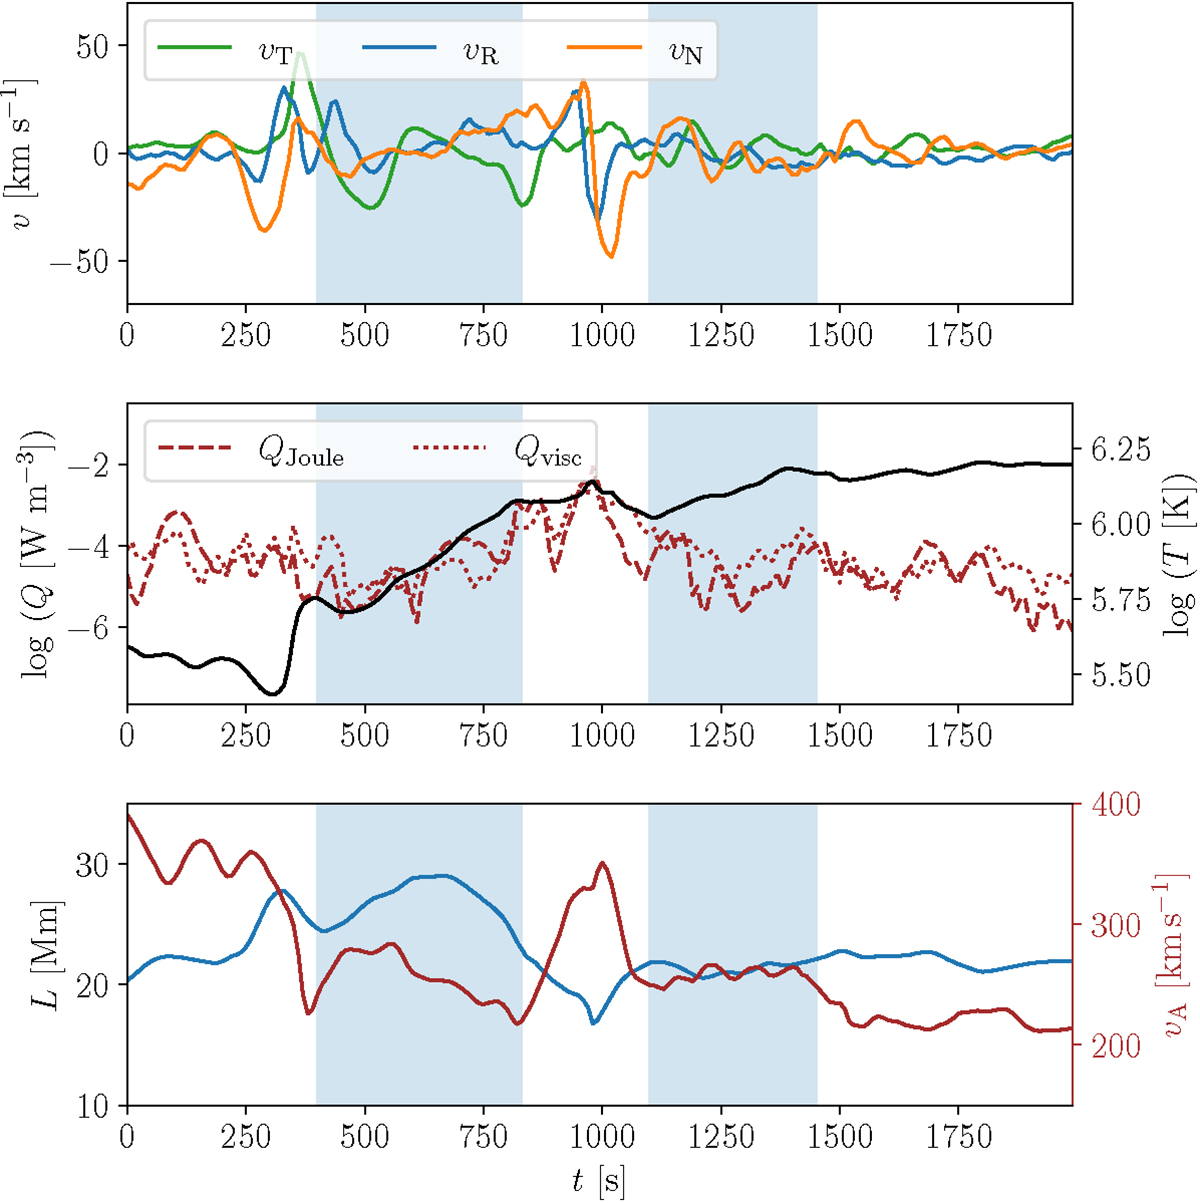
Bundle evolution time series. Top: evolution of the longitudinal (green), normal (orange) and binormal velocity component (blue) at the apex of the bundle. Middle: evolution of the Joule volumetric heating rate (dashed red), the viscous volumetric heating rate (dotted red) and the temperature (black) at the apex of the bundle. Bottom: evolution of the average length (blue) and the Alfvén speed at the apex of the loops in the bundle. The blue regions indicate the time range of the two oscillations.
Current usage metrics show cumulative count of Article Views (full-text article views including HTML views, PDF and ePub downloads, according to the available data) and Abstracts Views on Vision4Press platform.
Data correspond to usage on the plateform after 2015. The current usage metrics is available 48-96 hours after online publication and is updated daily on week days.
Initial download of the metrics may take a while.