Open Access
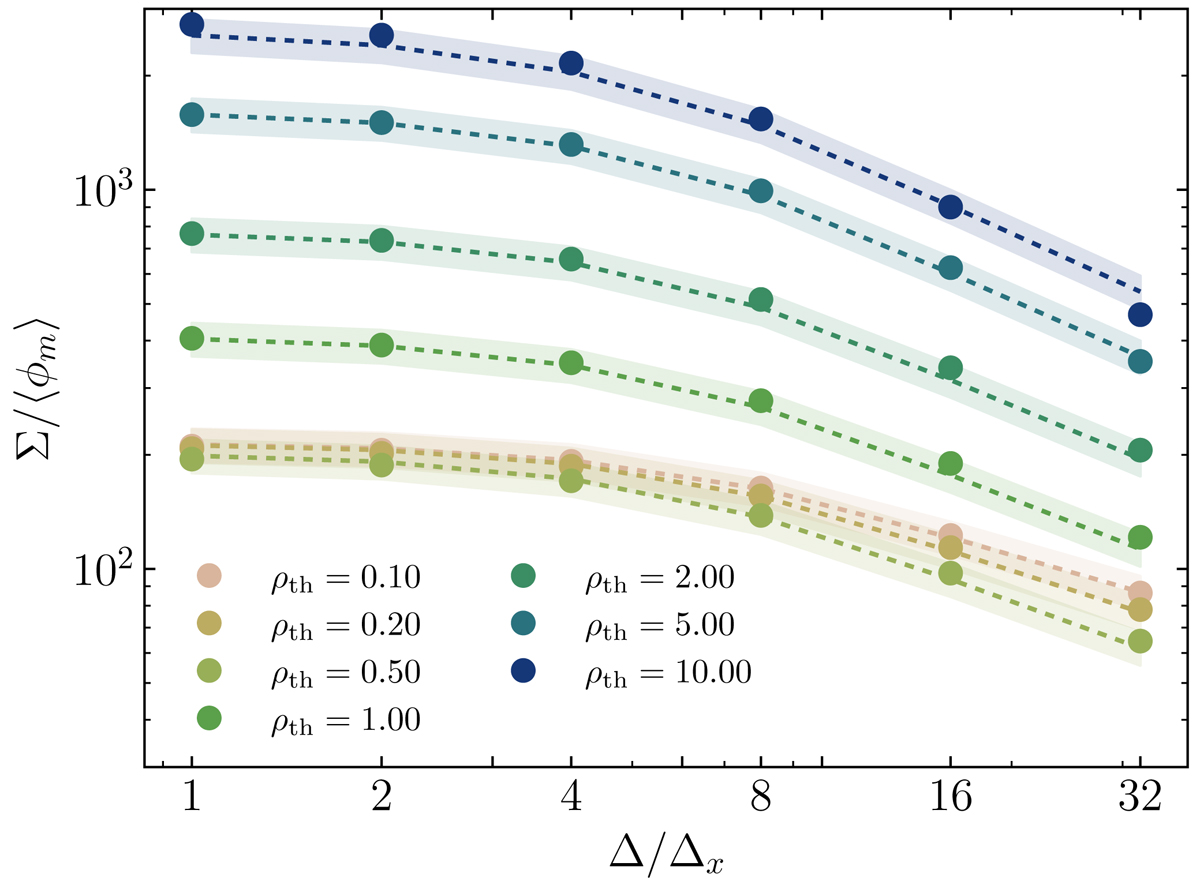
Fig. 12.
Download original image
Specific surface Σ/⟨ϕm⟩ as a function of Δ/Δx for ρth ranging from 0.1 to 10. The dashed lines show the prediction with Σ = κf(ηo/ηi)Ds − 2. The coloured filled regions correspond to a relative error of ±10%.
Current usage metrics show cumulative count of Article Views (full-text article views including HTML views, PDF and ePub downloads, according to the available data) and Abstracts Views on Vision4Press platform.
Data correspond to usage on the plateform after 2015. The current usage metrics is available 48-96 hours after online publication and is updated daily on week days.
Initial download of the metrics may take a while.