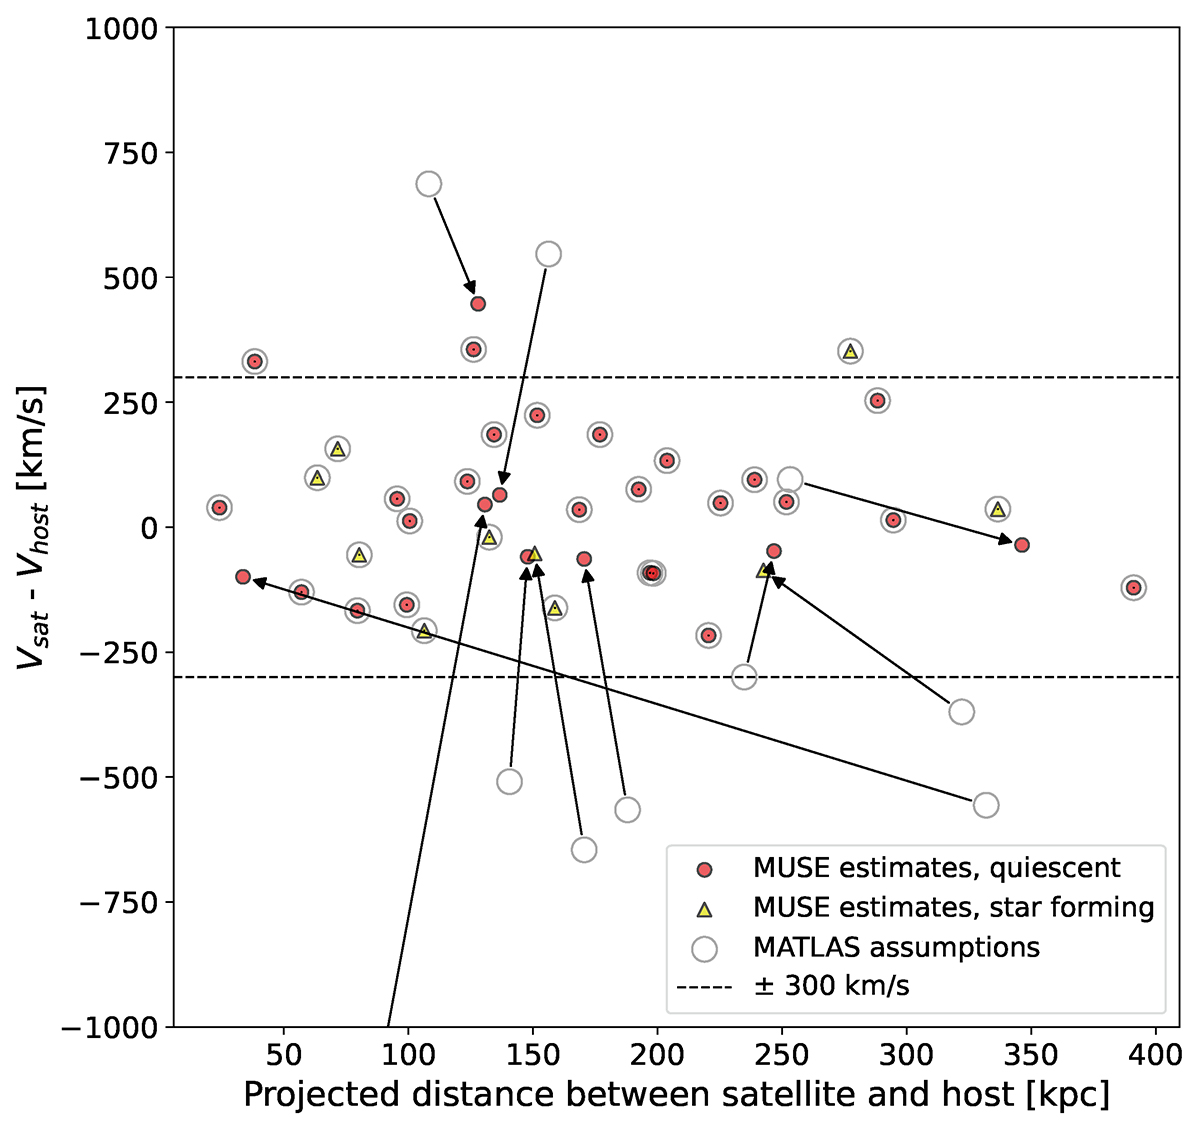
Fig. 7.
Download original image
Projected distance between satellite and assumed host galaxy in kpc vs. recessional velocity difference between satellite and host (ΔV = Vsat − Vhost) in km s−1. The projected distance and velocity difference to the host assumed in MATLAS are plotted (gray circles) compared with the updated host based on minimal ΔV through MUSE spectral fitting (red points). These shifts are indicated by black arrows. For the red points circled in gray the assumed host stays the same with new velocity information on the dwarf. The dashed black lines show ±300 km s−1.
Current usage metrics show cumulative count of Article Views (full-text article views including HTML views, PDF and ePub downloads, according to the available data) and Abstracts Views on Vision4Press platform.
Data correspond to usage on the plateform after 2015. The current usage metrics is available 48-96 hours after online publication and is updated daily on week days.
Initial download of the metrics may take a while.