Fig. 5.
Download original image
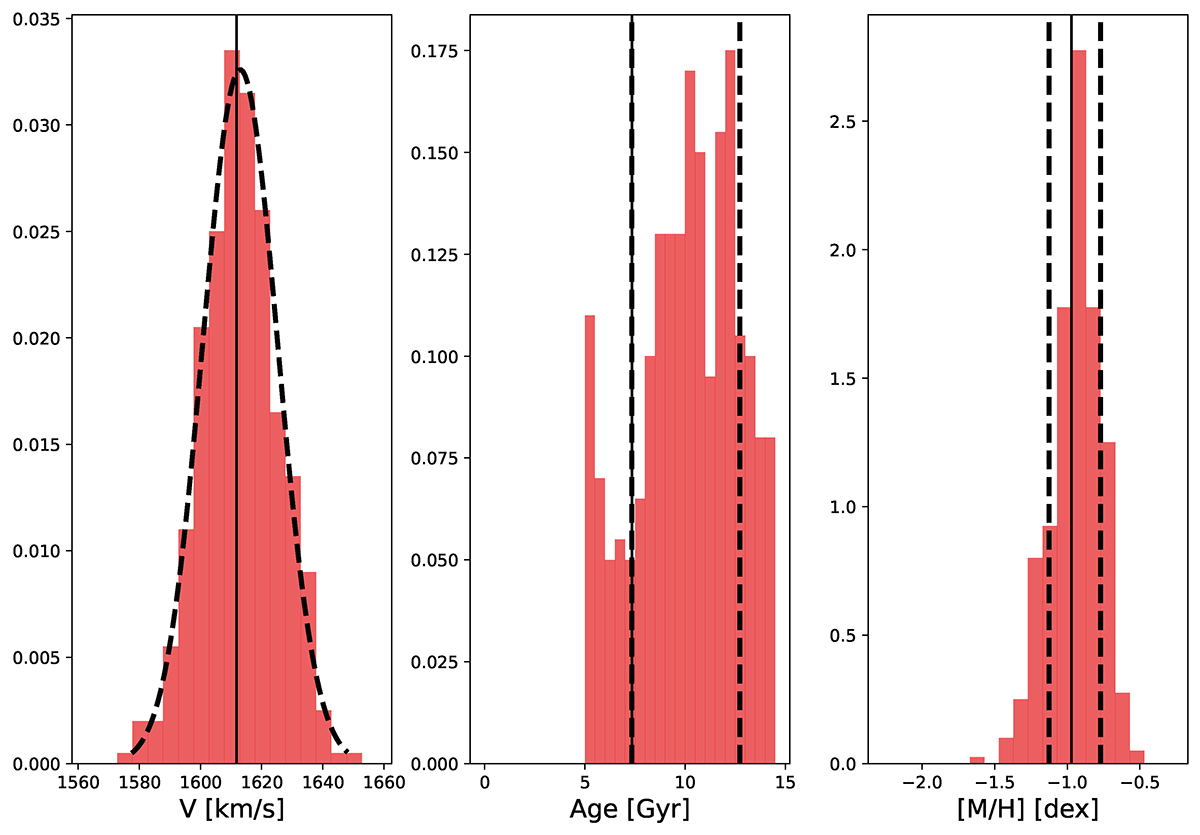
Results from the MC error estimation with 400 iterations for the galaxy MATLAS-269. The histograms show the distributions of the fit values for the recessional velocity V, the age, and the metallicity obtained from pPXF by randomly flipping the sign of the residual between the galaxy spectrum and the initial best fit. The solid lines indicate the best-fit values of the original spectrum, while the dashed lines show the standard deviation of the MC realizations. For the recessional velocity shown in the leftmost panel, we fit a Gaussian curve (dashed line) to the distribution of MC realizations.
Current usage metrics show cumulative count of Article Views (full-text article views including HTML views, PDF and ePub downloads, according to the available data) and Abstracts Views on Vision4Press platform.
Data correspond to usage on the plateform after 2015. The current usage metrics is available 48-96 hours after online publication and is updated daily on week days.
Initial download of the metrics may take a while.