Open Access
Fig. 3.
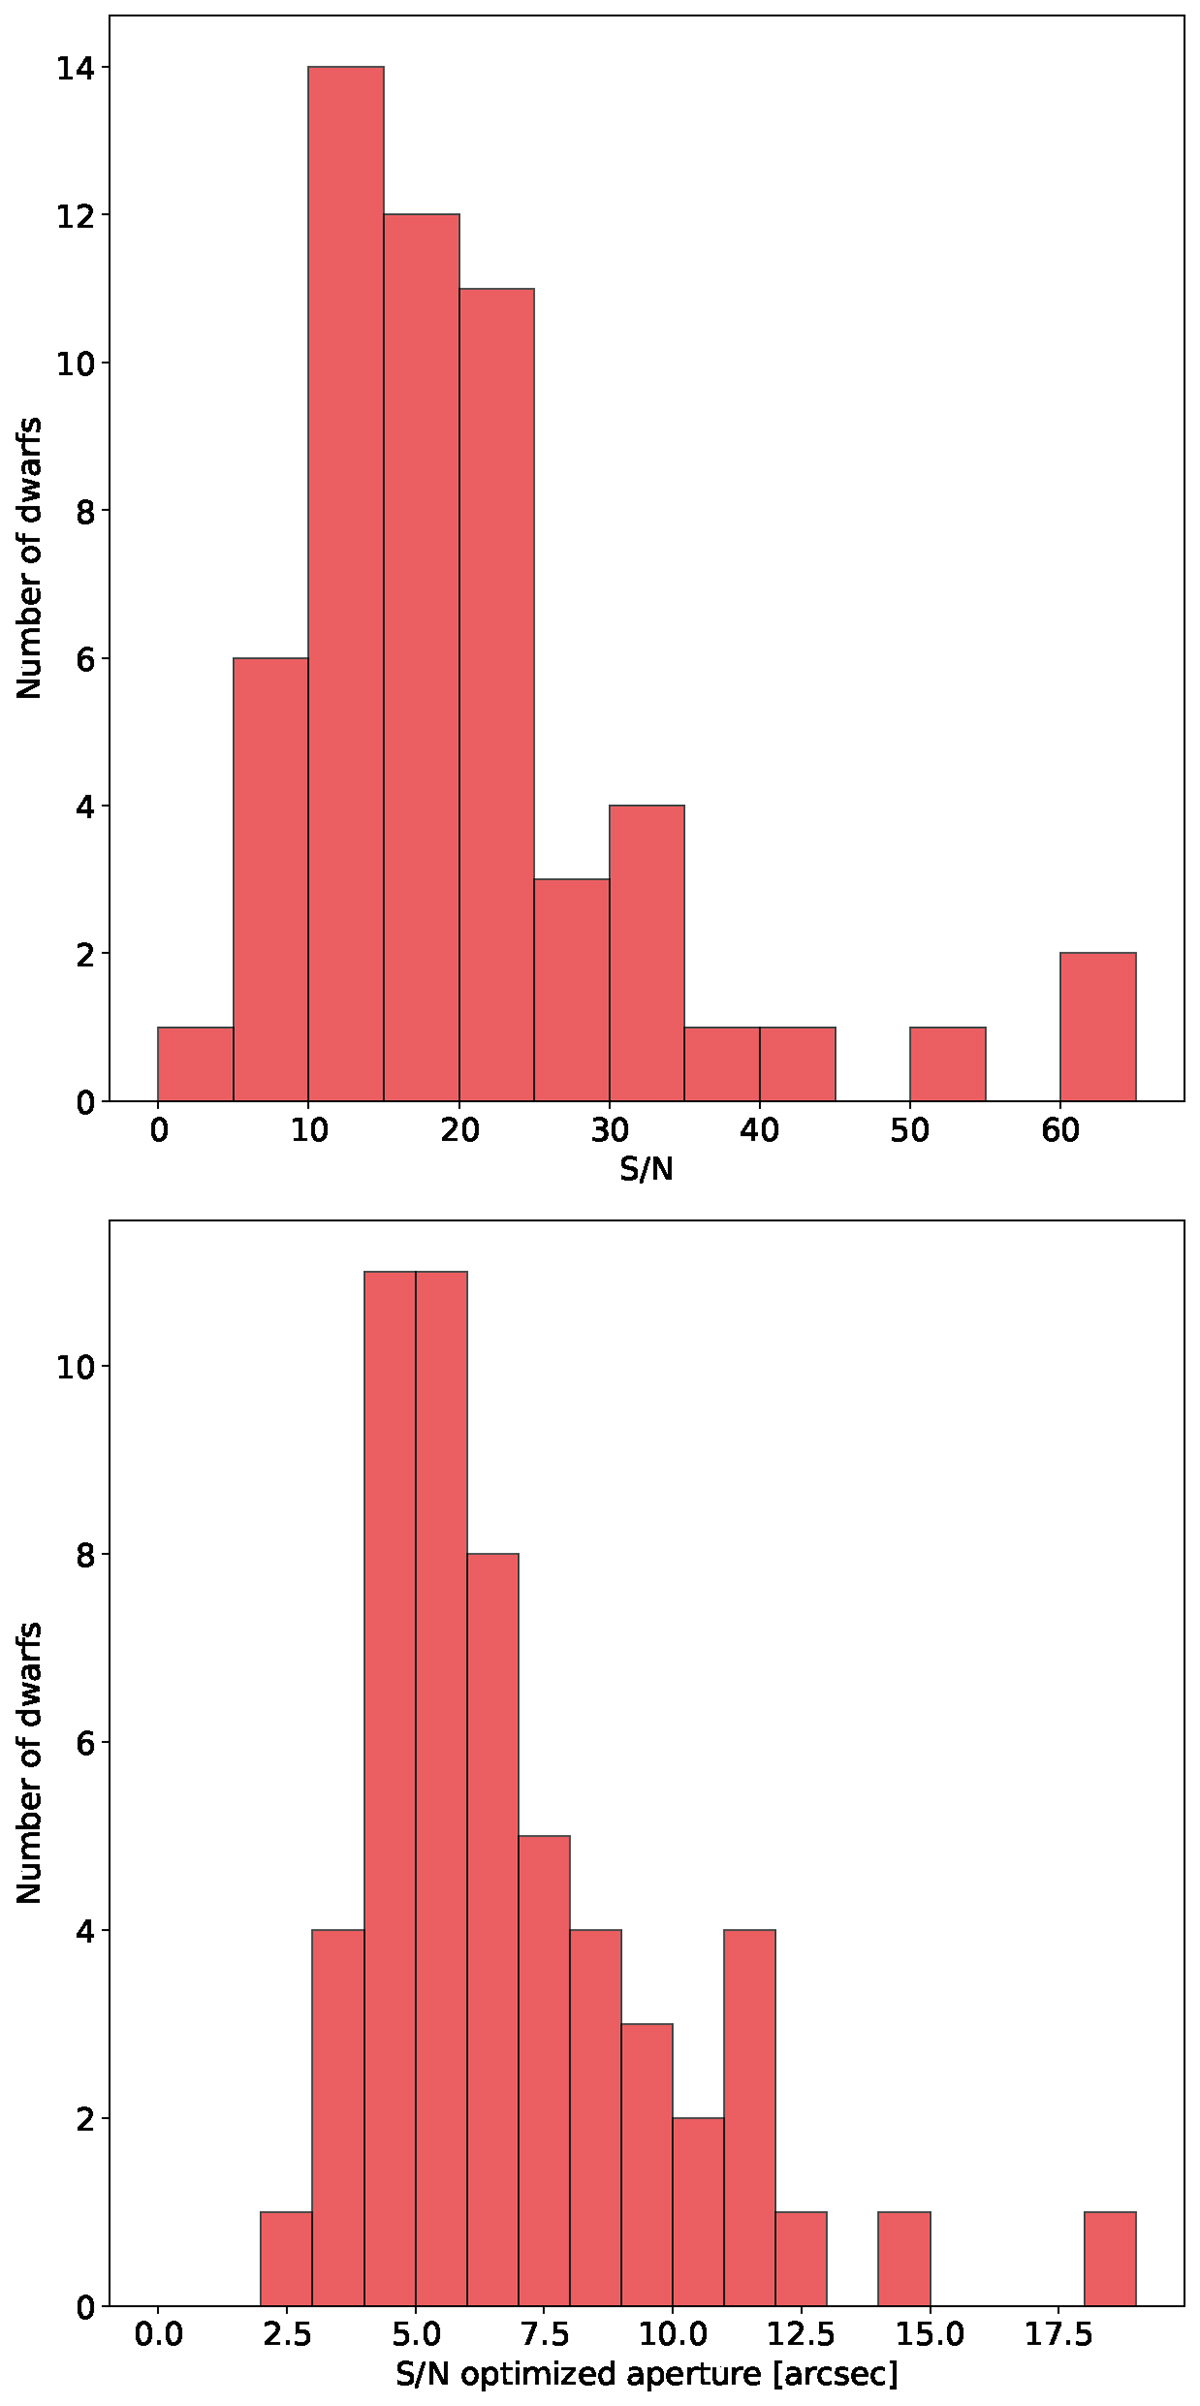
Download original image
Distributions of signal-to-noise ratios and corresponding optimized apertures from which the spectra were extracted. Top: distribution of S/N values for the sample of dwarf galaxies analyzed in this work. Bottom: distribution of S/N optimized apertures for the dwarf galaxies studied in this work.
Current usage metrics show cumulative count of Article Views (full-text article views including HTML views, PDF and ePub downloads, according to the available data) and Abstracts Views on Vision4Press platform.
Data correspond to usage on the plateform after 2015. The current usage metrics is available 48-96 hours after online publication and is updated daily on week days.
Initial download of the metrics may take a while.