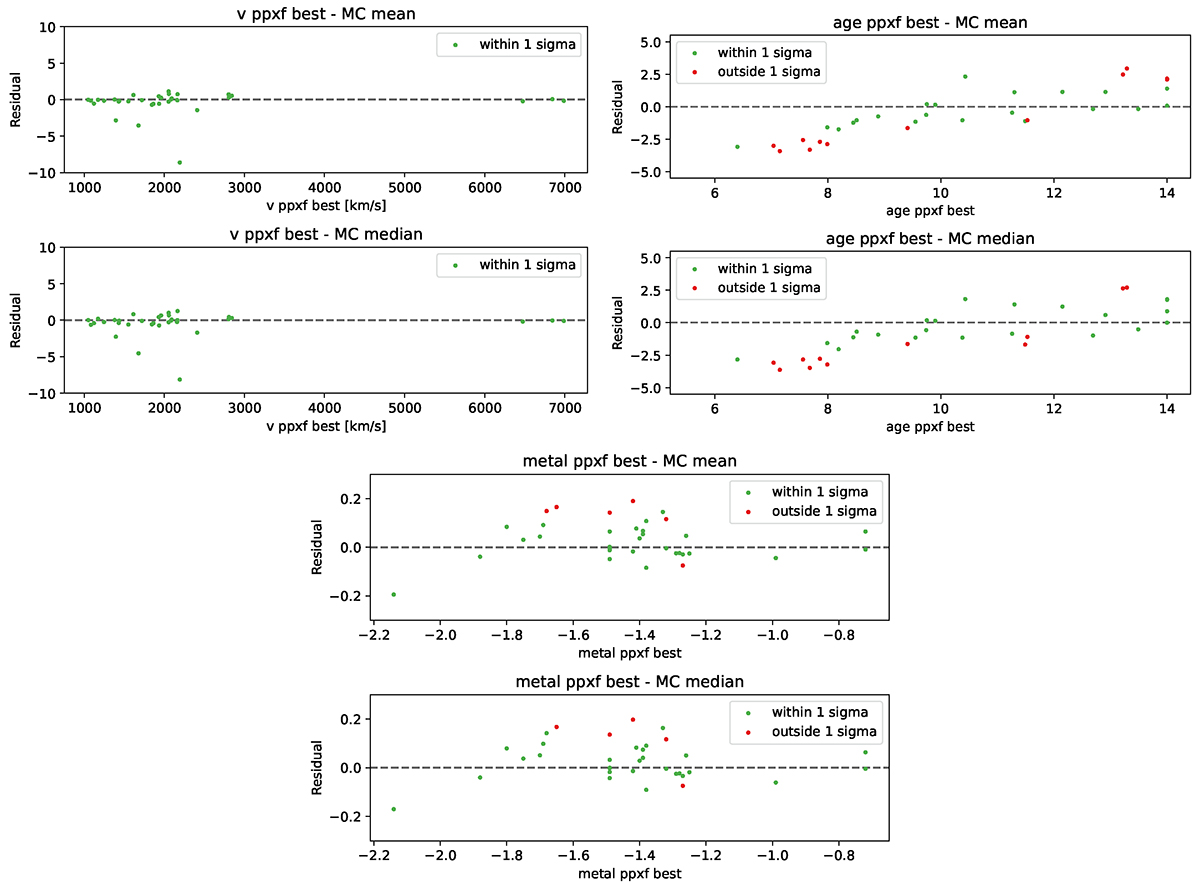
Fig. A.2.
Download original image
Residual plots of pPXF best-fit values subtracted by mean and median of the MC realizations for the parameters: recessional velocity (v; top left), age (top right), metallicity (bottom center). The green dots indicate that the best-fit value resides inside the 1σ bounds of the MC realizations; red means the value is outside of these bounds.
Current usage metrics show cumulative count of Article Views (full-text article views including HTML views, PDF and ePub downloads, according to the available data) and Abstracts Views on Vision4Press platform.
Data correspond to usage on the plateform after 2015. The current usage metrics is available 48-96 hours after online publication and is updated daily on week days.
Initial download of the metrics may take a while.