Fig. 10.
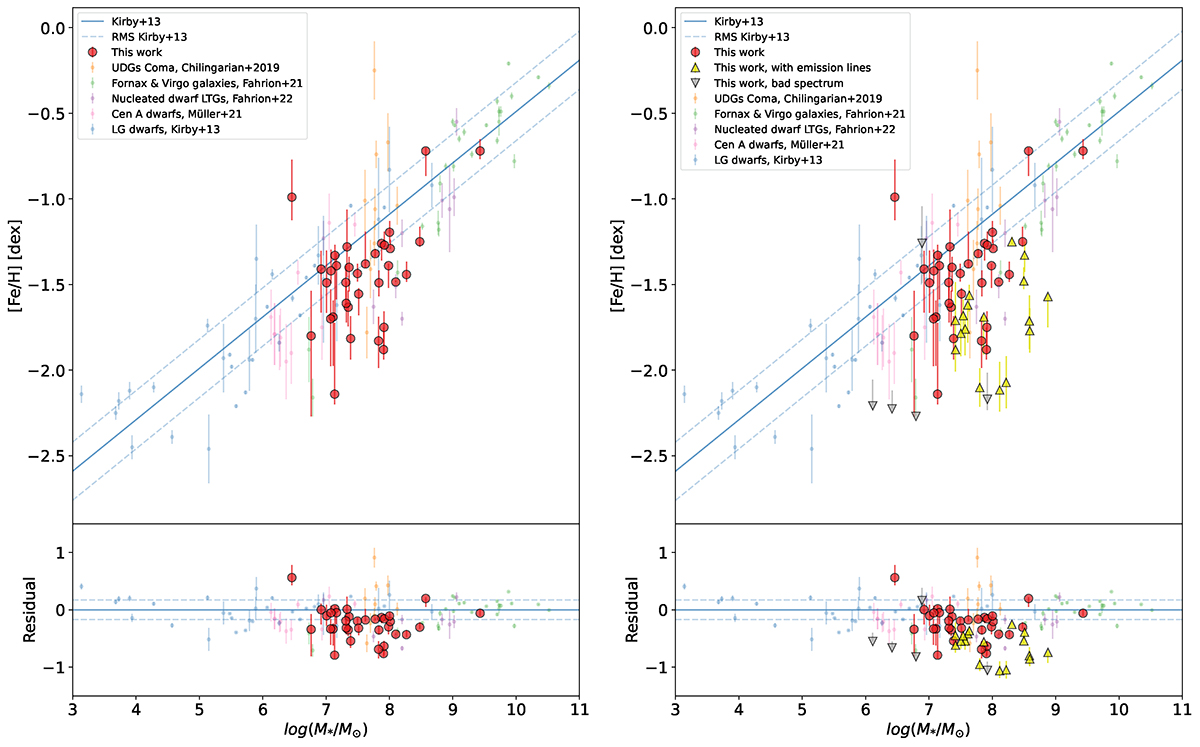
Download original image
Plot of universal stellar mass-metallicity relation from Kirby et al. (2013; blue solid line) with its rms (blue dashed lines). On the x-axis is plotted the logarithm of the stellar mass in units of solar mass. Left: data from this work (red circles), but excluding star forming and low S/N galaxies. Right: full sample from this work. Star forming galaxies are shown as yellow upward pointing triangles, while low S/N galaxies are gray downward pointing triangles. Shown is a comparison of our results with galaxies from other works: LG dwarfs (blue; Kirby et al. 2013), Cen A dwarfs (pink; Müller et al. 2021b), galaxies in Fornax and Virgo (green; Fahrion et al. 2021), nucleated dwarf LTGs (purple; Fahrion et al. 2022), and UDGs in the Coma cluster (orange; Chilingarian et al. 2019). Bottom: residual plots (i.e., metallicity dwarf-metallicity fit). The blue dashed lines indicate the rms of the fit from Kirby et al. (2013). The LG dwarf metallicities from Kirby et al. (2013) are iron metallicities ([Fe/H]), while all other data points show total metallicities ([M/H]).
Current usage metrics show cumulative count of Article Views (full-text article views including HTML views, PDF and ePub downloads, according to the available data) and Abstracts Views on Vision4Press platform.
Data correspond to usage on the plateform after 2015. The current usage metrics is available 48-96 hours after online publication and is updated daily on week days.
Initial download of the metrics may take a while.