Fig. 1.
Download original image
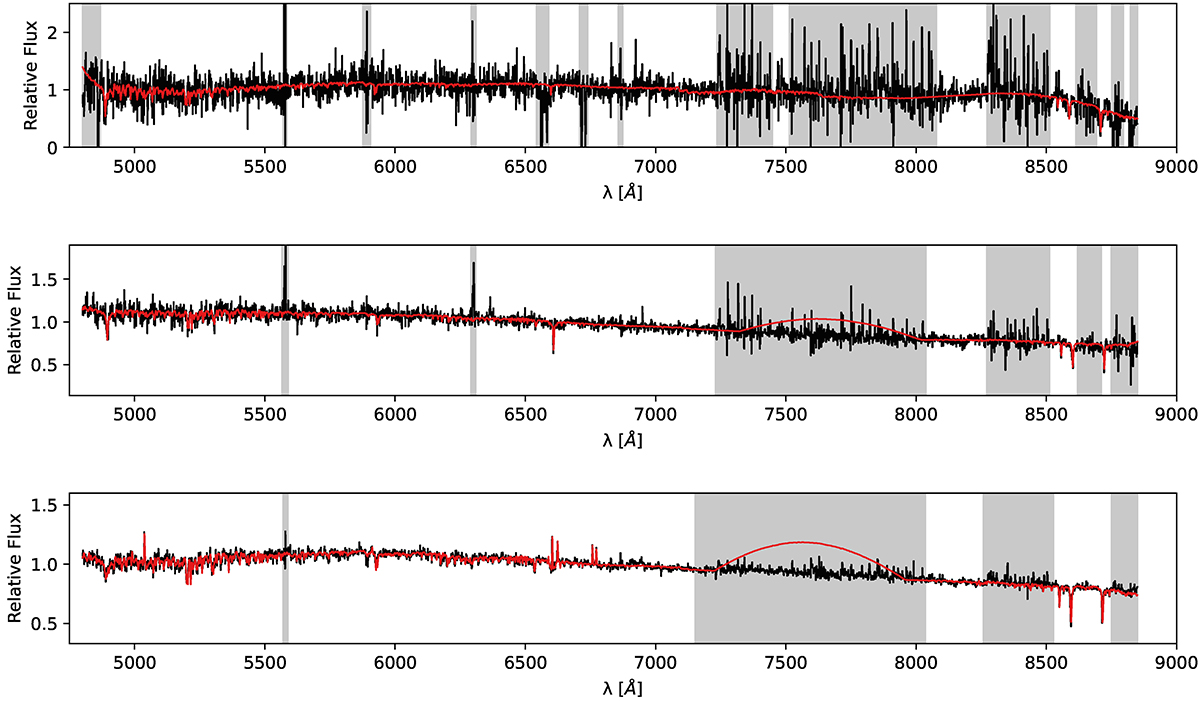
Examples of different quality spectra with different S/N values. Shown is the relative flux on the y-axis and the wavelength on the x-axis (in angstroms). These spectra have not been shifted to the rest frame. The black line is the galaxy spectrum and the red line the fit produced by pPXF. The gray regions were manually masked out to improve the fit. From top to bottom are shown the spectra for the galaxies MATLAS-269, MATLAS-1232, and MATLAS-10 with S/N values of 8.7, 26.0, and 61.9, respectively.
Current usage metrics show cumulative count of Article Views (full-text article views including HTML views, PDF and ePub downloads, according to the available data) and Abstracts Views on Vision4Press platform.
Data correspond to usage on the plateform after 2015. The current usage metrics is available 48-96 hours after online publication and is updated daily on week days.
Initial download of the metrics may take a while.