Fig. 5.
Download original image
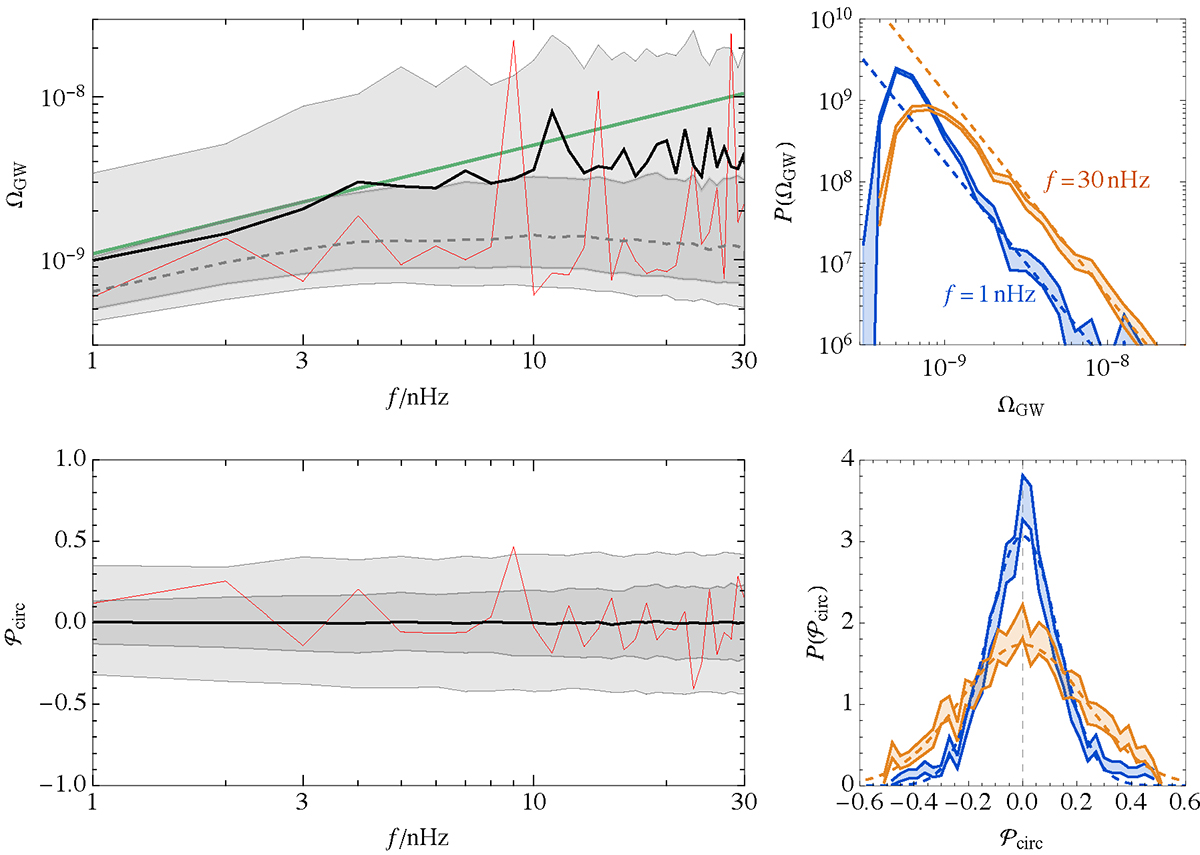
GW energy spectrum ΩGW and the fractional circular polarization 𝒫circ calculated from 1600 Monte Carlo realizations of the SMBH binary population. In the left panels, the black solid curve shows the mean and the gray bands the 68% and 95% CL regions of the Monte Carlo realizations, and the red curve corresponds to one of the realizations shown in Fig. 3. In the upper left panel the green line shows the mean GW energy density (8). The distributions of ΩGW and 𝒫GW at 1 nHz (blue) and at 30 nHz (orange) calculated from the Monte Carlo realizations are shown in the right panels. In the upper right panel, the dashed lines show ![]() , and in the lower right panel, the dashed curves show Gaussian fits to these distributions of width σ = 0.13 (blue) and σ = 0.23 (orange). In this figure, pBH = 0.17 is assumed.
, and in the lower right panel, the dashed curves show Gaussian fits to these distributions of width σ = 0.13 (blue) and σ = 0.23 (orange). In this figure, pBH = 0.17 is assumed.
Current usage metrics show cumulative count of Article Views (full-text article views including HTML views, PDF and ePub downloads, according to the available data) and Abstracts Views on Vision4Press platform.
Data correspond to usage on the plateform after 2015. The current usage metrics is available 48-96 hours after online publication and is updated daily on week days.
Initial download of the metrics may take a while.